Insights into Kildare County Business and Employment Demographics 2024
Explore key insights from the Kildare County Business & Employment Demographics report for 2024. The analysis focuses on the rates and Local Property Tax (LPT) scenario, workforce demographics, and workforce experience levels in the local authority area. It highlights the challenges faced by labor-intensive sectors and the importance of effective tax utilization by the Local Authority. The data reveals trends in job numbers, LPT rates, and workforce composition, providing valuable information for existing and prospective local authority members and businesses interested in the area.

Insights into Kildare County Business and Employment Demographics 2024
PowerPoint presentation about 'Insights into Kildare County Business and Employment Demographics 2024'. This presentation describes the topic on Explore key insights from the Kildare County Business & Employment Demographics report for 2024. The analysis focuses on the rates and Local Property Tax (LPT) scenario, workforce demographics, and workforce experience levels in the local authority area. It highlights the challenges faced by labor-intensive sectors and the importance of effective tax utilization by the Local Authority. The data reveals trends in job numbers, LPT rates, and workforce composition, providing valuable information for existing and prospective local authority members and businesses interested in the area.. Download this presentation absolutely free.
Presentation Transcript
Chambers Ireland z Kildare County Business & Employment Demographics 2024-03-04
z Theme 1: Kildare County Rates & LPT Audience: Existing/Prospective Local Authority members Income Highlights: Increasing reliance on Commercial Rates to support Local Authority Activities Key messages: Local Authority Budget Reform needed Rates system putting pressure on labour intensive & vulnerable sectors Hospitality Retail Manufacturing Obligation on Local Authority to use these taxes effectively
z Theme 1: Kildare County Rates & LPT Income Kildare County Local Authority Rates and LPT: 2016-2022 Year 2016 2017 2018 2019 2020 2021 2022 Jobs 95947 99094 102241 105388 108535 111682 114829 LPT NA NA Rates NA NA 16079635 16090559 17731578 17726658 18289092 59154552 59276480 60785745 61913937 61837115
z Theme 1: Kildare County Rates & LPT Income Kildare County Local Authority 2022 LPT/employee 159 Kildare County Local Authority 2022 Rates/employee 539
z Theme 2: Kildare County Workforce Demographics Audience: Membership/Businesses that are interested in expanding into the local area Highlights: Workforce details, who is available, education level, population growth Key messages: Varies from Local Authority area to area Important for you to understand the numbers of people who are available to work in your area, their experience levels and the training they have
z Theme 2: Kildare County Workforce Demographics Kildare County Local Authority Workforce Population Year Total_working Total_studying Total_recent_grads Total_job_seeking Total_not_seeking 2022 114829 22926 1580 7419 24236
z Theme 2: Kildare County Workforce Demographics Kildare County Local Authority Workforce Experience Level Year Professional Managerial Non_Manual Skilled_Manual Semi_Skilled Unskilled All_Others 2022 24388 84186 41686 32172 25712 6816 32814
z Theme 2: Kildare County Workforce Demographics Kildare County Local Authority Workforce Education Level Kildare County Local Authority Workforce Sectors
z Theme 3: Co. Kildare Business Demographics Audience: Internal to Chambers Highlights: Local Business Community Information Key messages: Varies from Local Authority area to area Local market intelligence to help you identify trends in your local area s business community i.e.: Sectoral activity increasing/decreasing What sectors the self-employed are active in
z Theme 3: Co. Kildare Business Demographics
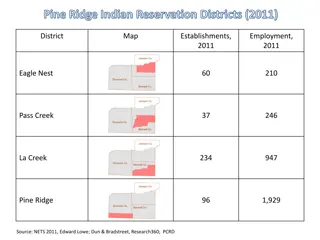
Sectors (B) Mining (C) Manufacturing (D) Energy/HVAC (E) Water/Waste (F) Construction (G) Retail (H) Logistics (I) Hospitality (J) IT (K) Financial (L) Property (M) Professional B2B (N) Support Services (P) Education (Q) Health (R) Arts/Recreation Businesses Owners Employees 18 722 23 53 3417 2030 1068 635 654 419 698 2096 746 686 791 547 89 382 0 z 8847 Theme 3: Co. Kildare Business Demographics 0 0 0 0 2223 894 848 304 208 86 439 1060 417 444 600 369 6474 14916 2426 5286 994 1379 602 5059 5160 5493 8884 1478 Employment in locally registered businesses, by Sector
z Theme 3: Co. Kildare Business Demographics Employment in locally registered businesses, by employer size - 2021
Employment .Size All persons engaged size classes Under 10 10 - 19 20 - 49 50 - 249 250 and over Businesses Owners Employees z 15372 8943 69699 Theme 3: Co. Kildare Business Demographics 14325 538 329 153 8801 108 31 14548 7112 9660 14077 24302 Employment in locally registered businesses, by employer size - 2021 2 1 27