Reservoir Storage-Yield Analyses Using HEC-ResSim Lecture #2

This lecture covers the theory of storage-yield analyses, focusing on understanding yield, types of yield like firm yield, methods to calculate yield, and the importance of storing water for re-distribution. It delves into within-year and over-year reservoir storage concepts, illustrating the minimum yield problem with real-world data.

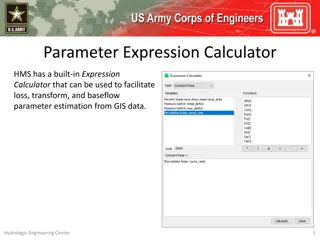
Download Presentation

Please find below an Image/Link to download the presentation.
The content on the website is provided AS IS for your information and personal use only. It may not be sold, licensed, or shared on other websites without obtaining consent from the author. Download presentation by click this link. If you encounter any issues during the download, it is possible that the publisher has removed the file from their server.
E N D
Presentation Transcript
Conducting Reservoir Storage-Yield Analyses Using HEC-ResSim Lecture #2 Storage-Yield Theory
Introduction What is Yield? What is Firm Yield? Storage / Yield theory What methods can be used to calculate yield? What is the USACE recommended method?
Yield What is Yield? Yield is the amount of water that can be supplied from the reservoir to a specified location and in a specified time pattern. (EM 1110- 2-1420) Definitions can vary, be careful! Don t assume a definition, and be sure to define yield for your own studies
Yield What are some yield types you have seen in your work? Firm Yield is typically used for water supply studies Firm yield is the largest consistent flow rate (demand) that can be provided throughout a period of historic stream-flow (EM 1110-2-1420) Firm Yield is limited by a critical period which will vary based on the demand and storage capacity. There are other types of yield There are other terms: critical yield, safe yield, dependable yield, etc
Storage / Yield Theory Why we store water: to re-distribute the occurrence of water in time Desire water at a certain rate The natural occurrence of water is inconvenient, often too low or too high Storage of water allows usage to change from the natural arrival rate to a more convenient rate Store water when it comes, use water when needed Use stored water when we need more than natural Refill when we need less than natural Store high flow and release at tolerable level
Storage / Yield Theory Within-year and Over-year Reservoir Storage and Yield 1400000 2500000 1200000 Inflow, Release (af/month) 2000000 Reservoir Storage (af) 1000000 1500000 800000 600000 1000000 400000 500000 200000 0 0 Within-year Reservoir Storage stores wet season water for use in the dry season Over-year Reservoir Storage stores wet year water for use in dry years or drought
Storage / Yield Theory: Minimum Yield Problem 14,000 inflow 12,000 10,000 Flow (cfs) 8,000 6,000 Average flow = 1900 cfs 4,000 2,000 0 Dec-79 Dec-80 Dec-81 Dec-82 Dec-83 Dec-84 Dec-85 Dec-86 Dec-87 Dec-88 Dec-89 Dec-90 Historical firm yield = min flow = 100 cfs High flows in spring, low flows in fall
Storage / Yield Theory: Conservation and Flood Pools Redistribution in time, need a higher minimum 14,000 inflow 12,000 10,000 Flow (cfs) 8,000 6,000 4,000 2,000 0 Dec-79 Dec-80 Dec-81 Dec-82 Dec-83 Dec-84 Dec-85 Dec-86 Dec-87 Dec-88 Dec-89 Dec-90
Storage / Yield Theory: Conservation and Flood Pools Redistribution in time, need a higher minimum 14,000 14,000 inflow inflow 12,000 12,000 outflow 10,000 10,000 Inflow / Outflow (cfs) Flow (cfs) 8,000 8,000 6,000 6,000 4,000 4,000 2,000 2,000 0 0 Dec-79 Dec-79 Dec-80 Dec-80 Dec-81 Dec-81 Dec-82 Dec-82 Dec-83 Dec-83 Dec-84 Dec-84 Dec-85 Dec-85 Dec-86 Dec-86 Dec-87 Dec-87 Dec-88 Dec-88 Dec-89 Dec-89 Dec-90 Dec-90 350000 300000 250000 Stored Water (AF) 200000 150000 100000 50000 0 Dec-79 Dec-80 Dec-81 Dec-82 Dec-83 Dec-84 Dec-85 Dec-86 Dec-87 Dec-88 Dec-89 Dec-90
Storage / Yield Theory: Conservation and Flood Pools Redistribution in time, need a lower maximum 14,000 inflow 12,000 10,000 Flow (cfs) 8,000 6,000 4,000 2,000 0 Dec-79 Dec-80 Dec-81 Dec-82 Dec-83 Dec-84 Dec-85 Dec-86 Dec-87 Dec-88 Dec-89 Dec-90
Storage / Yield Theory: Conservation and Flood Pools Redistribution in time, need a lower maximum 14,000 14,000 inflow inflow 12,000 12,000 outflow 10,000 10,000 Inflow / Outflow (cfs) Flow (cfs) 8,000 8,000 6,000 6,000 4,000 4,000 2,000 2,000 0 0 Dec-79 Dec-79 Dec-80 Dec-80 Dec-81 Dec-81 Dec-82 Dec-82 Dec-83 Dec-83 Dec-84 Dec-84 Dec-85 Dec-85 Dec-86 Dec-86 Dec-87 Dec-87 Dec-88 Dec-88 Dec-89 Dec-89 Dec-90 Dec-90 350000 300000 250000 Stored Water (AF) 200000 150000 100000 50000 0 Dec-79 Dec-80 Dec-81 Dec-82 Dec-83 Dec-84 Dec-85 Dec-86 Dec-87 Dec-88 Dec-89 Dec-90
Storage / Yield Theory: Conservation and Flood Pools Redistribution in time, change min and max 14,000 inflow 12,000 10,000 Flow (cfs) 8,000 6,000 4,000 2,000 0 Dec-79 Dec-80 Dec-81 Dec-82 Dec-83 Dec-84 Dec-85 Dec-86 Dec-87 Dec-88 Dec-89 Dec-90
Storage / Yield Theory: Conservation and Flood Pools Redistribution in time, change min and max 14,000 inflow 12,000 outflow 10,000 Inflow / Outflow (cfs) 8,000 6,000 4,000 2,000 0 Dec-79 Dec-80 Dec-81 Dec-82 Dec-83 Dec-84 Dec-85 Dec-86 Dec-87 Dec-88 Dec-89 Dec-90 350000 flood pool 300000 250000 Reallocation . Stored Water (AF) Guide Curve 200000 150000 conservation pool 100000 50000 0 Dec-79 Dec-80 Dec-81 Dec-82 Dec-83 Dec-84 Dec-85 Dec-86 Dec-87 Dec-88 Dec-89 Dec-90
Storage / Yield Relationship Firm yield is focused on the minimum flow. In a study, there are 2 ways to ask the question: Planning: For a given demand, how large must the reservoir at that location be? (storage requirement) Reassessment: For a given reservoir, what is the largest demand that can be supplied? (firm yield) To generate the storage/yield relationship, fix one variable, compute the other Supply Contract what volume is needed in existing reservoir to supply requested yield? (...share of inflow, share of space)
Storage / Yield Theory: Storage / Yield Curve The most basic evaluation is the at-site Storage / Yield relationship. Average Flow Actual yield Firm Yield Actual reservoir storage volume Reservoir Storage Volume
Storage / Yield Theory: Storage / Yield Curve The most basic evaluation is the at-site Storage / Yield relationship. Average Flow Desired Demand Firm Yield Required storage volume Reservoir Storage Volume
Storage / Yield Theory: Yield as a Function of Storage and Inflow Firm Yield depends on storage volume and reservoir inflows
Storage / Yield Theory: Critical Period Firm Yield is limited by the critical period diverting the firm yield will bring the stored water exactly to zero during this period Top of Con Pool Critical Period Bottom of Con Pool
Firm Yield Analysis How do we determine the firm yield of a reservoir (or a portion of a reservoir), or needed storage? Simpler methods are based on determining the maximum cumulative deficit, which tells us how much water needs to have been stored Rippl Mass Diagrams Sequent Peak Method Simulation methods instead find the maximum demand that can be met with specific storage capacity and operations Iterative Simulation Optimization (Linear Programming) can solve for either yield or required storage
Firm Yield Analysis 1,200 1,200 Monthly Flow Volume (KAF/month) Monthly Flow Volume (KAF/month) = 4,857 cfs 1,000 1,000 average = 294 average = 294 KAF/mo KAF/mo 800 800 600 600 400 400 200 200 0 0 Oct-67 Oct-70 Oct-73 Oct-76 Oct-79 Oct-82 Oct-85 Oct-88 Oct-91 Oct-94 Oct-97 Oct-00 Oct-03 Oct-06 Oct-67 Oct-70 Oct-73 Oct-76 Oct-79 Oct-82 Oct-85 Oct-88 Oct-91 Oct-94 Oct-97 Oct-00 Oct-03 Oct-06
Firm Yield Analysis 1,200 Demand = 100 kaf/mo Monthly Flow Volume (KAF/month) 1,000 average = 294 KAF/mo 800 600 400 200 demand = 100 kaf/mo 0 Oct-67 Oct-70 Oct-73 Oct-76 Oct-79 Oct-82 Oct-85 Oct-88 Oct-91 Oct-94 Oct-97 Oct-00 Oct-03 Oct-06
1,200 Demand = 100 kaf/mo Monthly Flow Volume (KAF/month) 1,000 average = 294 KAF/mo 800 600 400 200 0 Oct-67 Oct-70 Oct-73 Oct-76 Oct-79 Oct-82 Oct-85 Oct-88 Oct-91 Oct-94 Oct-97 Oct-00 Oct-03 Oct-06 4000 Reservoir Storage (KAF) 3500 3000 2500 2000 Reservoir size = 669 KAF 1500 1000 500 0 Oct-67 Oct-70 Oct-73 Oct-76 Oct-79 Oct-82 Oct-85 Oct-88 Oct-91 Oct-94 Oct-97 Oct-00 Oct-03 Oct-06
Firm Yield Analysis 1,200 1,200 Demand = 100 kaf/mo Demand = 200 kaf/mo Monthly Flow Volume (KAF/month) Monthly Flow Volume (KAF/month) 1,000 1,000 average = 294 KAF/mo KAF/mo KAF/mo average = 294 average = 294 800 800 600 600 400 400 200 200 demand = 100 kaf/mo demand = 200 kaf/mo 0 Oct-67 Oct-70 Oct-73 Oct-76 Oct-79 Oct-82 Oct-85 Oct-88 Oct-91 Oct-94 Oct-97 Oct-00 Oct-03 Oct-06 Oct-67 Oct-70 Oct-73 Oct-76 Oct-79 Oct-82 Oct-85 Oct-88 Oct-91 Oct-94 Oct-97 Oct-00 Oct-03 Oct-06 0
1,200 Demand = 200 kaf/mo Monthly Flow Volume (KAF/month) 1,000 average = 294 average = 294 KAF/mo KAF/mo 800 600 400 200 demand = 200 kaf/mo 0 Oct-67 Oct-70 Oct-73 Oct-76 Oct-79 Oct-82 Oct-85 Oct-88 Oct-91 Oct-94 Oct-97 Oct-00 Oct-03 Oct-06 4000 Reservoir Storage (KAF) 3500 3000 2500 2000 1500 Reservoir size = 4,068 KAF 1000 500 0 Oct-67 Oct-70 Oct-73 Oct-76 Oct-79 Oct-82 Oct-85 Oct-88 Oct-91 Oct-94 Oct-97 Oct-00 Oct-03 Oct-06
Rippl Mass Diagrams Simple method, usable for constant demands Graphical comparison between cumulative inflows and cumulative demands
Rippl Mass Diagrams 160,000 160,000 cumulative demand cumulative demand 140,000 140,000 Accumulated Inflow (KAF) Accumulated Inflow (KAF) 120,000 120,000 100,000 100,000 80,000 80,000 cumulative inflow cumulative inflow 2nd critical period 60,000 60,000 40,000 40,000 1st critical period 20,000 20,000 0 0 Oct-67 Oct-70 Oct-73 Oct-76 Oct-79 Oct-82 Oct-85 Oct-88 Oct-91 Oct-94 Oct-97 Oct-00 Oct-03 Oct-06 Oct-67 Oct-70 Oct-73 Oct-76 Oct-79 Oct-82 Oct-85 Oct-88 Oct-91 Oct-94 Oct-97 Oct-00 Oct-03 Oct-06
Rippl Mass Diagrams 42,500 1st critical period Accumulated Inflow (KAF) 40,000 2,600 KAF storage needed 200 KAF/mo 37,500 669 KAF storage needed 100 KAF/mo 35,000 Nov-75 Nov-76 Nov-77 Nov-78
Rippl Mass Diagrams 100,000 2nd critical period 95,000 100 KAF/mo Accumulated Inflow (KAF) 90,000 200 KAF/mo 85,000 4,068 KAF storage needed 80,000 75,000 Dec-86 Dec-87 Dec-88 Dec-89 Dec-90 Dec-91 Dec-92 Dec-93 Dec-94
Sequent Peak Method More flexible, allows seasonally varying demands Accumulate Net Inflow = Inflow Demand for each time step, find greatest dip OR, calculate a deficit (Demand - Inflow) each time step and accumulate as long as positive The amount of storage needed to supply the input demand is determined from the maximum accumulated deficit
Sequent Peak Method 100,000 0 90,000 -100 Release = 100 KAF/month Accumulated NET Inflow (KAF) = S S(I-R) 80,000 -200 70,000 Accumulated Shortage (KAF) 60,000 -300 50,000 -400 40,000 30,000 -500 669 KAF storage needed 20,000 -600 10,000 - -700 Nov-67 Nov-72 Nov-77 Nov-82 Nov-87 Nov-92 Nov-97 Nov-02 Nov-07
Sequent Peak Method 50,000 0 45,000 -500 Accumulated NET Inflow (KAF) = S S(I-R) 40,000 -1,000 Release = 200 KAF/month Accumulated Shortage (KAF) 35,000 -1,500 30,000 -2,000 25,000 4,068 KAF storage needed -2,500 20,000 2,600 KAF storage needed -3,000 15,000 -3,500 10,000 -4,000 5,000 0 Nov-67 -4,500 Nov-72 Nov-77 Nov-82 Nov-87 Nov-92 Nov-97 Nov-02 Nov-07
Iterative Simulation Most complex, most accurate and detailed With reservoir simulation model, allows consideration of other reservoir purposes, losses, interaction with other reservoirs, and downstream requirements Requires mass balance of reservoir inflows, outflows, and storage each timestep By trial & error, finds demand that exactly empties storage volume (1)set firm yield, iterate for minimum storage (simple mass balance) or (2)set storage, iterate for max firm yield (reservoir simulation model)
1,200 Demand = 100 kaf/mo Monthly Flow Volume (KAF/month) 1,000 average = 294 KAF/mo 800 600 400 200 0 Oct-67 Oct-70 Oct-73 Oct-76 Oct-79 Oct-82 Oct-85 Oct-88 Oct-91 Oct-94 Oct-97 Oct-00 Oct-03 Oct-06 4000 Reservoir Storage (KAF) 3500 3000 2500 2000 Reservoir size = 669 KAF 1500 1000 500 0 Oct-67 Oct-70 Oct-73 Oct-76 Oct-79 Oct-82 Oct-85 Oct-88 Oct-91 Oct-94 Oct-97 Oct-00 Oct-03 Oct-06
1,200 Demand = 200 kaf/mo Monthly Flow Volume (KAF/month) 1,000 average = 294 average = 294 KAF/mo KAF/mo 800 600 400 200 demand = 200 kaf/mo 0 Oct-67 Oct-70 Oct-73 Oct-76 Oct-79 Oct-82 Oct-85 Oct-88 Oct-91 Oct-94 Oct-97 Oct-00 Oct-03 Oct-06 4000 Reservoir Storage (KAF) 3500 3000 2500 2000 1500 Reservoir size = 4,068 KAF 1000 500 0 Oct-67 Oct-70 Oct-73 Oct-76 Oct-79 Oct-82 Oct-85 Oct-88 Oct-91 Oct-94 Oct-97 Oct-00 Oct-03 Oct-06
4000000 3000000 Inflow, Demand (af/month) 2000000 1000000 Reservoir size = af 4068400 0 Oct-67 Oct-71 Oct-75 Oct-79 Oct-83 Oct-87 Oct-91 Oct-95 Oct-99 Oct-03 Oct-07 1400000 Avg Monthly Release = af 197816 197 KAF / mo 1200000 1000000 Inflow, Demand 800000 (af/month) 600000 400000 200000 0 Oct-67 Oct-71 Oct-75 Oct-79 Oct-83 Oct-87 Oct-91 Oct-95 Oct-99 Oct-03 Oct-07 4000000 3000000 Inflow, Demand (af/month) 2000000 1000000 Reservoir size = af 4068400 0 Oct-67 Oct-71 Oct-75 Oct-79 Oct-83 Oct-87 Oct-91 Oct-95 Oct-99 Oct-03 Oct-07 1400000 Avg Monthly Release = af 182340 182 KAF / mo 1200000 1000000 Inflow, Demand 800000 (af/month) 600000 400000 200000 0 Oct-67 Oct-71 Oct-75 Oct-79 Oct-83 Oct-87 Oct-91 Oct-95 Oct-99 Oct-03 Oct-07
Iterative Simulation This is the recommended USACE method for yield calculation Highly flexible and accurate Efficient with current computing power HEC-ResSim is the focus of this training course Other reservoir models that can be used for studies include: RiverWare OASIS SUPER HEC-5 MS Excel
Storage / Yield Theory: Storage / Yield Curve 300 300 300 3600 3600 3600 average streamflow average streamflow average streamflow 250 250 250 3000 3000 3000 Release/Yield (KAF/month) Release/Yield (KAF/month) Release/Yield (KAF/month) Release/Yield (KAF/year) Release/Yield (KAF/year) Release/Yield (KAF/year) 200 200 200 2400 2400 2400 150 150 150 1800 1800 1800 Firm Yield Firm Yield 100 100 100 1200 1200 1200 1st critcal period, mid-70s 1st critcal period, mid-70s 1st critcal period, mid-70s 50 50 50 600 600 600 2nd critical period, early-90s 2nd critical period, early-90s 2nd critical period, early-90s yield curve 0 0 0 0 0 0 4068 669 0 0 0 2,500 2,500 2,500 5,000 5,000 5,000 7,500 7,500 7,500 10,000 10,000 10,000 12,500 12,500 12,500 Reservoir Storage (KAF) Reservoir Storage (KAF) Reservoir Storage (KAF)
Storage / Yield Theory: S/Y Curve as firm yield per volume 1.2 14 12 1 10 KAF/mo / KAF KAF/year / KAF 0.8 8 0.6 6 0.4 4 0.2 2 0 0 0 2,500 5,000 Reservoir Size (KAF) 7,500 10,000 12,500
Storage / Yield Theory: Yield for Portions of Storage 270 210 Shared Conservation Pool 135
Other Yields Firm Yields can be calculated for uses other than water supply Hydropower, downstream minimum flows, water quality requirements Simpler methods don t apply Requires iterative simulation with models that capture those uses Additional information may be required: power head, other flows, etc.
Hydropower Yield Hydropower yield can also be calculated with iterative simulation using the same model Need turbine characteristics in model Here we look at minimum energy generation instead of flow KWH or similar units
Usable Storage What are the limits of the con pool? What do we mean by zero storage? Concept of usable storage Usable storage does not include: Dedicated hydropower head Sediment reserve ( inactive pool , sediment pool , dead storage ) Forecasted sedimentation over the life of the project is defined as 100-year for reservoirs and 50 years for navigation projects.
Knowledge Check What is the definition of yield? Yield is the amount of water that can be supplied from the reservoir to a specified location and in a specified time pattern. How does Firm Yield differ from this general definition? Firm Yield is defined as the highest consistent flow rate that can be provided through a period of historical streamflow. A firm yield is limited by a critical period, and is calculated using the historical period of record.
Knowledge Check How does the Sequent Peak Method compare to Iterative Simulation? The Sequent Peak Method is simpler, but is limited to using a constant guide curve and no other reservoir uses. Iterative Simulation can be much more detailed and complex, and can include other reservoir purposes, competing demands and losses. What is the USACE recommended method? Why? Iterative Simulation, because it provides the best balance of usability and power.
Knowledge Check How is the firm yield affected by increasing conservation storage in the reservoir? What about increasing flood storage? Increased conservation storage will increase the firm yield but will decrease the marginal yield per acre-ft. The increase will generally not be linear. Increasing the flood storage by raising the dam will not impact firm yield, but increasing flood storage by reallocating from conservation storage will impact firm yield. If a water user cuts back use during an extreme drought, does that affect the firm yield? In studies, firm yield is usually defined as a constant theoretical amount based only on available storage size. Changing actual diversion amounts will not affect the firm yield calculation. Cutbacks and other drought contingency measures can add a factor of safety for droughts worse than the critical period.
Knowledge Check Is firm yield impacted by outlet capacity limits at low pool elevations? A study can define firm yield as the theoretical available diversion, regardless of current diversion capacity. Or it can use the actual current outlet works to limit yield. It depends on the needs and purpose of the study. Again, be clear about assumptions and definitions.
Knowledge Check Is dead/inactive storage included in a firm yield calculation? Does having a buffer zone at the bottom of the conservation pool impact firm yield? Firm yield study results will depend on the specific formulation of the study. Firm yield will typically be based on usable storage as defined in USACE policy. Inactive storage, future sedimentation space, and storage reserved for hydropower head are generally not included in usable storage. It is important to clearly identify and clearly record your definitions and assumptions.