Open-Source Energy System Modeling
Benefits and drawbacks of open-source energy system modeling and examines illustrative results on global emissions pathways. It also discusses new scenario logic for the long-term temperature goal of the Paris Agreement and presents climate scenarios for Austria.
- open-source
- energy system modeling
- barriers
- global emissions pathways
- paris agreement
- climate scenarios

Download Presentation

Please find below an Image/Link to download the presentation.
The content on the website is provided AS IS for your information and personal use only. It may not be sold, licensed, or shared on other websites without obtaining consent from the author. Download presentation by click this link. If you encounter any issues during the download, it is possible that the publisher has removed the file from their server.
E N D
Presentation Transcript
Lecture 5: What s next? Open-Source Energy System Modeling TU Wien, VU 370.062 Dipl.-Ing. Dr. Daniel Huppmann This presentation is licensed under a Creative Commons Attribution 4.0 International License
Part 1 Open-source energy system modelling boon or bane? Open-Source Energy System Modeling, Lecture 5 Daniel Huppmann 2
Open-source lowers barriers to entry for energy-system++ modelling The barriers to energy system modelling are almost zero. Is that a good thing? Required ingredients to energy system modelling Cheap computing power to run large-scale assessments Open-source tools for data processing, model execution, and results analysis Publicly available data sets Free lecture material, online courses, etc. Youtube channel Teaching Energy Modelling OSeMOSYS Teaching Kit A Learning material resource of the Horizon 2020 project: https://www.ecemf.eu/learn/ The barriers to start model development are virtually zero Advantage: democratization of research Disadvantage: risk of doing subpar research (herd behaviour, quick-and-dirty analysis) The academic incentive structure is misaligned towards novelty rather than collaborative work Open-Source Energy System Modeling, Lecture 5 Daniel Huppmann 3
Part 2 Some illustrative results on global emissions pathways Open-Source Energy System Modeling, Lecture 5 Daniel Huppmann 4
A new scenario logic for the Paris long-term temperature goal Going beyond bounds on cumulative emissions to specific policy choices Previously, many IAM studies used a constraint on cumulative GHG emissions. This emphasised end-of-century warming and it puts a lot of (implicit) weight on discount rates, future technology availability, CDR, BECCS, etc. We propose a new scenario logic closely following the text of the Paris Agreement. Policy choice Policy choice Corresponding to Corresponding to Year of net-zero Year of peak warming Ambition until net-zero Level of peak warming Long-term CO2 removal Rogelj, Huppmann, et al. (2019). Nature 573(7774):357-363. doi: 10.1038/s41586-019-1541-4 Temperature reduction rate Open-Source Energy System Modeling, Lecture 5 Daniel Huppmann 5
The role of net-zero in mitigation scenarios Many models use temperature over-shoot & net-negative emissions. This increases the risk of reaching tipping points. Many scenarios allow net-negative emissions like Carbon Capture and Sequestration (CCS) to fulfill a constrained carbon budget until the end of the century. This model behavior leads to a so-called temperature overshoot , which increases the risk of tipping points. In this manuscript, we compare scenarios with vs. without overshoot. Scenarios without overshoot are economically advantageous in the long term, but require steeper emissions reductions in the near term. Frigure from Cost and attainability of meeting stringent climate targets without overshoot Riahi, Bertram, Huppmann et al., Nature Climate Change (2021) | doi: 10.1038/s41558-021-01215-2 Open-Source Energy System Modeling, Lecture 5 Daniel Huppmann 6
Structure of sectoral emissions in the year of net-zero emissions Rapid decarbonization of energy supply & land use In scenarios without temperature overshoot, energy supply and land use (AFOLU) are decarbonized rapidly, while transport and industry reach CO2-neutrality only towards the end of the century. Diese Aussage ist konsistent ber verschiedene prozess-basierte IAMs . Figure from Cost and attainability of meeting stringent climate targets without overshoot Riahi, Bertram, Huppmann et al., Nature Climate Change (2021) | doi: 10.1038/s41558-021-01215-2 Open-Source Energy System Modeling, Lecture 5 Daniel Huppmann 7
Part 3 Scenarios for in Austria Open-Source Energy System Modeling, Lecture 5 Daniel Huppmann 8
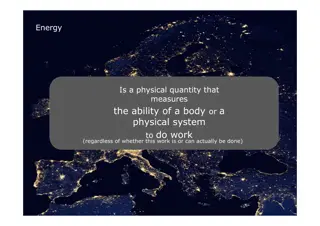
Climate futures for Austria Temperature increases in Austria are above the global average https://www.zamg.ac.at/cms/de/klima/news/klimafakten-oesterreich-kompakt Open-Source Energy System Modeling, Lecture 5 Daniel Huppmann 9
Climate scenarios for Austria the KS 15 Two RCP scenarios are downscaled to very detailed Austrian resolution The KS 15 analysed two scenarios: A baseline RCP8.5 An mitigation case RCP4.5 Caveats of the KS 15: The scenarios were published in 2015 The next update is planned for 2026 Project klimaszenarien.AT Scenarios considered ambitious 10 years ago are now in line with implemented policies (i.e., RCP4.5 could be considered as baseline today) https://www.bmk.gv.at/themen/klima_umwelt/klimaschutz/ anpassungsstrategie/publikationen/oeks15.html Open-Source Energy System Modeling, Lecture 5 Daniel Huppmann 10
Pathways towards Austrian climate neutrality In 2019, the Climate Change Center Austria (CCCA) published a reference pathway towards Austrian climate neutrality Kirchengast, G., Kromp-Kolb, H., Steininger, K et al. (2019): Referenzplan als Grundlage f r einen [..] Nationalen Energie- und Klimaplan f r O sterreich (Ref-NEKP) https://ccca.ac.at/refnekp Wegener Center Statement "Treibhausgasbudget f r sterreich auf dem Weg zur Klimaneutralit t 2040 , September 23, 2021 Open-Source Energy System Modeling, Lecture 5 Daniel Huppmann 11
Economic recovery after COVID and climate policy What are possible synergies between the COVID recovery measures and our long-term climate neutrality ambition? In December 2020, the EU agreed on a ratcheting-up of its climate ambition -55% reduction by 2030 (relative to 1990) instead of -40% reduction In response, Steininger et al. compared three scenarios to understand benefits of simultaneous economic recovery and climate policy Main findings: Temporary window of opportunity turns transformation costs into benefits (assuming no crowding-out during the recession) Enhanced climate-oriented investment can address both the economic and climate crisis A stricter near-term climate target avoids expensive fossil lock-in in the buildings sector and enhances technological leadership in Austrian strongholds The Economic Effects of Achieving the 2030 EU Climate Targets in the Context of the Corona Crisis An Austrian Perspective Karl W. Steininger et al., 2021 https://wegccloud.uni-graz.at/s/yLBxEP9KgFe3ZwX Open-Source Energy System Modeling, Lecture 5 Daniel Huppmann 12
A roadmap to become independent from Russian fossil gas imports The Austrian Energy Agency recently developed a roadmap to become independent from Russian fossil gas by 2027 Strategische Handlungsoptionen f r eine o sterreichische Gasversorgung ohne Importe aus Russland Austrian Energy Agency, April 2022 | https://energyagency.at Open-Source Energy System Modeling, Lecture 5 Daniel Huppmann 13
Part 3 What do we need to (not) do ? The following section may contain (cynical) political commentary. It s fine to quote/cite, but when you do, please provide context that these statements reflect my opinion and are not (necessarily) based on quantitative, model-based research. Open-Source Energy System Modeling, Lecture 5 Daniel Huppmann 14
A little quiz It s not always easy to keep track of policy statements vs. actual policy What is the current legal deadline for reaching climate neutrality in Austria? Trick question, there is currently no valid Klimaschutzgesetz in Austria There is only a coalition agreement and an Entschlie ungsantragdes Nationalrats https://www.parlament.gv.at/PAKT/VHG/XXVII/E/E_00160/index.shtml Which federal states have the lowest number of wind turbines: Vorarlberg, Tirol, Salzburg? Trick question, none of them has any The City of Vienna announced a Mega-Radweg-Paket in 2022 How many meters of protected bike lanes will be built in Favoriten? (population 200k) Zero But to be fair, the Mega-Radweg-Paket 2023 & 2024 has some good projects for Favoriten Open-Source Energy System Modeling, Lecture 5 Daniel Huppmann 15
From model-based scenarios to actual policy measures For obvious near-term climate policy measures at the local & region level you really don t need sophisticated models There are many no-regret options that could be implemented easily, and there are numerous best-practice examples Transition to renewable energy & electrification wherever possible Demand reduction & energy efficiency (in the building sector) Transition of the mobility sector (public transport, bikes & slow mobility, e-mobility) Dietary change There is a risk of talking too much about the 1.5 C limit We will likely exceed the 1.5 C threshold in some years within the next decade It is more helpful to push for decarbonization and structural change, and then see at which temperature level we stabilize Open-Source Energy System Modeling, Lecture 5 Daniel Huppmann 16
The Klimafahrplan of the City of Vienna The City of Vienna recently announced an ambitious and detailed roadmap to reach climate neutrality by 2040 The Klimafahrplan covers many key aspects: Energy transition Mobility New heating & cooling of buildings Adaption to climate change (green city) Climate health The main questions: Political credibility? Speed of transformation? https://www.wien.gv.at/umwelt-klimaschutz/klima-fahrplan-2040.html Open-Source Energy System Modeling, Lecture 5 Daniel Huppmann 17
Part 4 So you have some results... How can you present them to maximize impact? A few comments on better-practice for communication of insights Open-Source Energy System Modeling, Lecture 5 Daniel Huppmann 18
The importance of framing for good science communication Scientists (engineers in particular) tend to frown upon framing Economists believe in the invisible hand of efficient markets They too often ignore the key assumption of full information in markets Engineers are confident that they have the right answer and hope that science will prevail Social scientists and marketing executives understand the importance of communication They understand the role of appropriate words, intuitive visuals, appealing to emotions, etc. Framing is not about distorting the message! It means ensuring that message & messaging are aligned and reflect the same values! Possible entrypoints: George Lakoff, Professor Emeritus at the University of California, Berkeley https://framelab.us (check out their podcast) Podcast Petajoule by the Austrian Energy Agency (in German) Open-Source Energy System Modeling, Lecture 5 Daniel Huppmann 19
An example for great framing: More than showing ranges of scenarios The arrows indicate that more (ambition) means less (GHG emissions) and they illustrate how various levels of ambitions build on each other Figure 1 | Global greenhouse gas emissions as implied by INDCs compared to no-policy baseline, current-policy and 2 C scenarios. Joeri Rogelj et al. (2016) Paris Agreement climate proposals need a boost to keep warming well below 2 C. Nature 534:631, 2016. doi: 10.1038/nature18307 Open-Source Energy System Modeling, Lecture 5 Daniel Huppmann 20
Visualizing beyond the data: include icons and other elements in figures The key messages of this commentary are the process as much as the data, so it s ok to include an appealing visual representation to highlight this aspect Figure 1 | Overview of process of compilation of scenario ensemble data and illustrative data visualizations. D. Huppmann et al. (2018). A new scenario resource for integrated 1.5 C research. Nature Climate Change, 8:1027-1030. doi: 10.1038/s41558-018-0317-4 Open-Source Energy System Modeling, Lecture 5 Daniel Huppmann 21
Visual design elements Be aware how your audience will experience presentations or posters Meme from social media, unknown attribution Open-Source Energy System Modeling, Lecture 5 Daniel Huppmann 22
Better communication of research: Designing more appealing posters Scientists feel pressured to put all their knowledge in a manuscript/onto a poster, but creating a wall of text is not a good approach to communicate your work Check out the full video for #betterposters at https://www.youtube.com/watch?v=1RwJbhkCA58 Open-Source Energy System Modeling, Lecture 5 Daniel Huppmann 23
Writing style Good writing is an art, and it should be treated as such Gary Provost, 100 Ways to Improve Your Writing via https://www.theedublogger.com/10-tips-for-making-your-blog-posts-easier-to-read/ Open-Source Energy System Modeling, Lecture 5 Daniel Huppmann 24
A short clip on how to improve data table visualization via Twitter from @jessicadjewell https://t.co/gE0qnRxBLK Open-Source Energy System Modeling, Lecture 5 Daniel Huppmann 25
Boosting the signal to deliver better talks You probably spend too little time on preparing presentations of your work Scientific presentations are too often confusing, boring & overstuffed Giving a good conference presentation or research seminar talk can open doors Some practical considerations: Read the room tailor your talk to the audience Be clear about your main message and deliver your take-away message at the start Make a (new) plan don t just re-animate an old PowerPoint presentation Storyboard your presentation Be kind to your audience and connect Write sentence headline titles and explain figures (ideally one per slide) Don t (necessarily) follow the one slide per minute rule Boosting the Signal, Scott S. George & Michael White, 26 March 2020, Nature doi: 10.1038/d41586-020-00838-3 Open-Source Energy System Modeling, Lecture 5 Daniel Huppmann 26
Thank you very much for your attention! Dr. Daniel Huppmann Senior Research Scholar Energy, Climate, and Environment Program International Institute for Applied Systems Analysis (IIASA) Schlossplatz 1, A-2361 Laxenburg, Austria huppmann@iiasa.ac.at @daniel_huppmann @daniel_huppmann@mastodon.social www.iiasa.ac.at/staff/daniel-huppmann This presentation is licensed under a Creative Commons Attribution 4.0 International License