Phylogenetic Analysis of Enzyme Sequences in Plant Species
The content discusses the amino acid sequence alignment and phylogenetic tree analysis of enzyme sequences, specifically DcLCYB2, among different plant species including Daucus carota, Carica papaya, Citrus maxima, Solanum lycopersicum, and Crocus sativus. The study explores the genetic relationships and similarities between these enzymes, providing insights into the evolutionary history and functional characteristics of the enzymes in various plants.

Phylogenetic Analysis of Enzyme Sequences in Plant Species
PowerPoint presentation about 'Phylogenetic Analysis of Enzyme Sequences in Plant Species'. This presentation describes the topic on The content discusses the amino acid sequence alignment and phylogenetic tree analysis of enzyme sequences, specifically DcLCYB2, among different plant species including Daucus carota, Carica papaya, Citrus maxima, Solanum lycopersicum, and Crocus sativus. The study explores the genetic relationships and similarities between these enzymes, providing insights into the evolutionary history and functional characteristics of the enzymes in various plants.. Download this presentation absolutely free.
Presentation Transcript
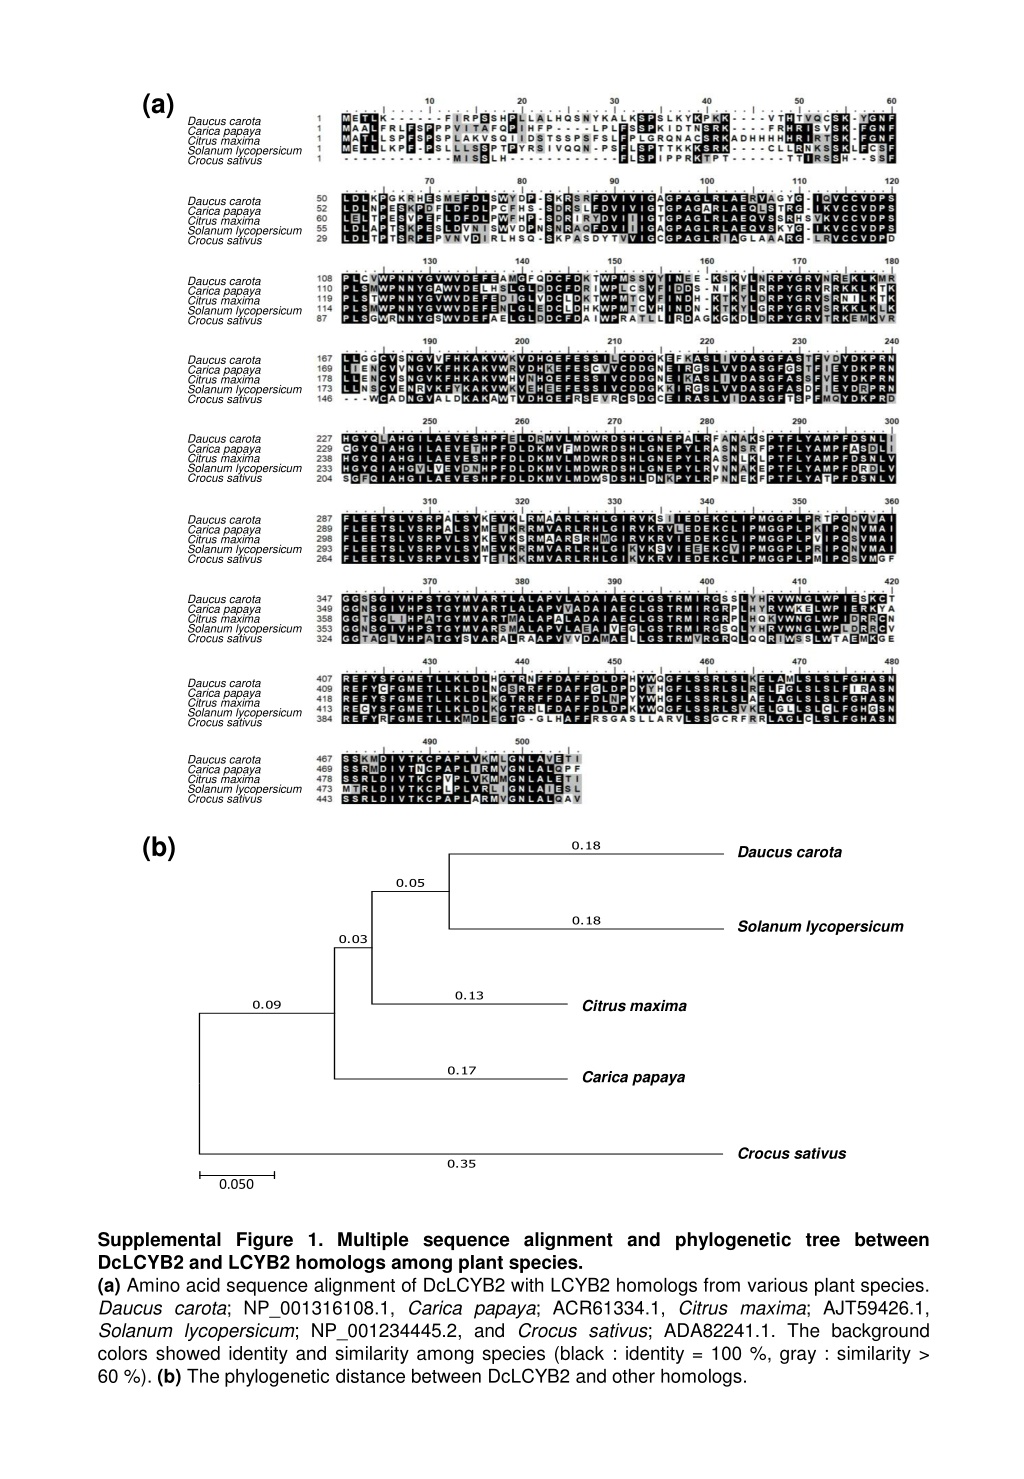
(a) Daucus carota Carica papaya Citrus maxima Solanum lycopersicum Crocus sativus Daucus carota Carica papaya Citrus maxima Solanum lycopersicum Crocus sativus Daucus carota Carica papaya Citrus maxima Solanum lycopersicum Crocus sativus Daucus carota Carica papaya Citrus maxima Solanum lycopersicum Crocus sativus Daucus carota Carica papaya Citrus maxima Solanum lycopersicum Crocus sativus Daucus carota Carica papaya Citrus maxima Solanum lycopersicum Crocus sativus Daucus carota Carica papaya Citrus maxima Solanum lycopersicum Crocus sativus Daucus carota Carica papaya Citrus maxima Solanum lycopersicum Crocus sativus Daucus carota Carica papaya Citrus maxima Solanum lycopersicum Crocus sativus 0.18 NP_001316108.1 capsanthin/capsorubin synthase chromoplastic-like Daucus carota subsp. sativus 0.05 (b) 0.18 0.18 NP_001316108.1 capsanthin/capsorubin synthase chromoplastic-like Daucus carota subsp. sativus Daucus carota NP_001234445.2 neoxanthin synthase chloroplastic Solanum lycopersicum 0.03 0.05 0.13 0.18 NP_001234445.2 neoxanthin synthase chloroplastic Solanum lycopersicum Solanum lycopersicum AJT59426.1 LCY2B Citrus maxima 0.09 0.03 0.17 0.13 AJT59426.1 LCY2B Citrus maxima Citrus maxima ACR61334.1 lycopene beta-cyclase 2 Carica papaya 0.09 0.17 ACR61334.1 lycopene beta-cyclase 2 Carica papaya Carica papaya ADA82241.1 chromoplast-specific lycopene beta cyclase Crocus sativus 0.35 ADA82241.1 chromoplast-specific lycopene beta cyclase Crocus sativus Crocus sativus 0.35 0.050 0.050 Supplemental Figure 1. Multiple sequence alignment and phylogenetic tree between DcLCYB2 and LCYB2 homologs among plant species. (a) Amino acid sequence alignment of DcLCYB2 with LCYB2 homologs from various plant species. Daucus carota; NP_001316108.1, Carica papaya; ACR61334.1, Citrus maxima; AJT59426.1, Solanum lycopersicum; NP_001234445.2, and Crocus sativus; ADA82241.1. The background colors showed identity and similarity among species (black : identity = 100 %, gray : similarity > 60 %). (b) The phylogenetic distance between DcLCYB2 and other homologs. 0.050
Supplemental Figure 2. Alignment of DcLCYB1 amino acid sequences among D802, D904, GD2002 and GD2003 inbred lines.
D802 D904 GD2002 GD2003 D802 D904 GD2002 GD2003 D802 D904 GD2002 GD2003 D802 D904 GD2002 GD2003 D802 D904 GD2002 GD2003 D802 D904 GD2002 GD2003 D802 D904 GD2002 GD2003 D802 D904 GD2002 GD2003 D802 D904 GD2002 GD2003 Supplemental Figure 3. Alignment of DcLCYB2 amino acid sequences among D802, D904, Gd2002 and GD2003 inbred lines.
Supplemental Figure 4. Alignment of DcLCYE amino acid sequences among D802, D904, GD2002 and GD2003 inbred lines.
DcLCYB1/LCYB2/LCYE (a) (b) XhoI SmaI crtE crtI crtB AtLCYB lac promoter lac pro tet pro pATLCYbsk pAC-LYC AmpR CmR T7 pro Cat pro Supplemental Figure 5. Constructions of DcLCYs for the enzyme activities using E. coli complementation assay. (a and b) The vector map of pAC-LYC (a) and pATLCYBsk (b). DcLCYB1, LCYB2 and LCYE were cloned into the sites of AtLCYB using smaI and xhoI restriction enzyme (b).
")