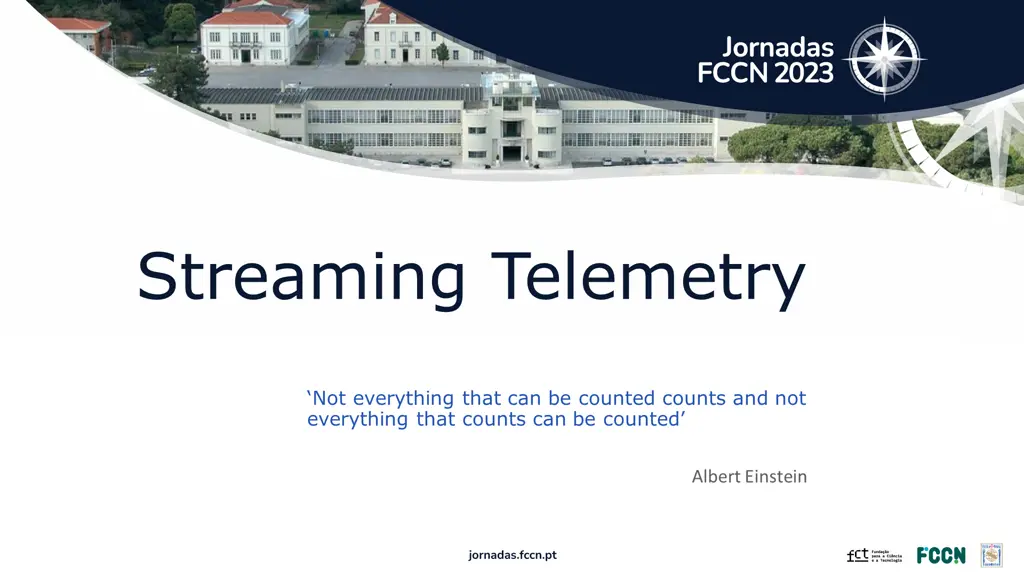
Streaming Telemetry
Explore the power of streaming telemetry and the motivation to move away from SNMP. Improve troubleshooting and problem resolution with better visibility through migration to GRPC Dial Out Telemetry. Pushing more data really does work better!

Download Presentation

Please find below an Image/Link to download the presentation.
The content on the website is provided AS IS for your information and personal use only. It may not be sold, licensed, or shared on other websites without obtaining consent from the author. Download presentation by click this link. If you encounter any issues during the download, it is possible that the publisher has removed the file from their server.
E N D
Presentation Transcript
Streaming Telemetry Not everything that can be counted counts and not everything that counts can be counted
Hidden Agenda In this session we will: -> Drive your motivation to kill SNMP!
Motivation How do you monitor your Network? If this is a picture of your NOC personnel You may have a Finger-Defined Network.
Why Change For us, personally: Switches logs full of messages: %SNMP-3-RESPONSE_DELAYED: processing GetNext of entSensorType (150023 msecs) , too many SNMP collectors Routers: Change of default values in control-plane policies to accommodate the rate of snmp requests Inability to fetch important data in equipment's, ie: evpn/perf-meas Short spaced glitches where very hard to see Plan in motion to: -> Improve visibility to help troubleshoot = faster problem resolution
Version TLDR: Too Long Didnt Read YANG Language Defined in 2010 by RFC 6020 by Tail-f s Martin Bjorklund, to provide a modeling language for NETCONF expanded beyond Human readable, easy to learn representation compact C and Java-like syntax Hierarchical models with reusable types and groupings Supports definition of operations (RPCs) Constraints and configuration validation Well-defined version rules How to configure Model: Cisco-IOS-XE-interfaces-oper.yang Xpath/Sensor: /interfaces-ios-xe-oper:interfaces/interface/interface-type
Version TLDR: Too Long Didnt Read Icinga Anycast IP Telegraph (Collector) InfluxDB (TSDB) Grafana Network
Streaming Telemetry Stack
First Things, First: Telemetry Stack So, what is all this fuss about Streaming Telemetry Real-time data collection and transmission for monitoring. Continuous and automated delivery of telemetry data. Faster issue detection and response. Enables historical data analysis. Relies on efficient and reliable protocols. Provides visibility into network and system operations. Optimizes performance, enhances security, ensures reliability. Scream Stream If You Want to Go Faster
Data Model Layer Raw data maped to a model (YANG models: Native, OpenConfig, etc)
YANG Yet Another Next Generation Self-contained top-level hierarchy of nodes Import or define data types Containers group related nodes Lists for sequence of entries Leaf nodes for simple data
YANG Yet Another Next Generation Native Models OpenConfig Models Aaaa, and IETF too . In the present day, a router has about 1300 Native models and 100 OpenConfig models
Wheres Wally? A complete guide on how to find Xpath sensor path s in the correct yang model 101: Google it GPT it Yangsuite Github Pyang CLI based commands
Producer Layer Time intervals definitions for the models
Publication options On-change Periodic Time based publications Event notifications (failed login, optics fault, etc) Minimum interval 1s State and Configuration
Telemetry Taxonomy Model-Driven Telemetry Event-Driven Telemetry Router X Router X 100 Interfaces UP/ 0 Down 100 Interfaces UP/ 0 Down 100 Interfaces UP/ 0 Down Time Time Time Time 100 Interfaces UP/ 0 Down 99 Interfaces UP/ 1 Down 99 Interfaces UP/ 1 Down 99 Interfaces UP/ 1 Down
Points of Consideration - Equipment's ALERTING What sensors/instrumentation are supported? What is max/min frequency of export? Can it be exported by event (on-change)? COLLECTOR What is the most-specific branch needed to export? VISUALIZATION DATABASE NETWORK
Exporter Layer Encoding and transportation for the models gNMI gRPC NETCONF It s all about the APIs RESTCONF Get it!? Apey Eyes SNMP CLI
MDT Modes, Dial-In vs Dial-Out Dial-out Dial-in Broader flexibility in transport options A single channel (config and streaming) No need to open ports for inbound management traffic Listening port on the router No MDT configuration on the router Anycast & Load-balancing Only gRPC/gNMI available
Transport: Google Remote Procedure Call (gRPC) A modern opensource high performance RPC framework Provides push or pull methods to obtain metrics Highly efficient on wire and with a simple service definition framework Device to collector PUSH method is one-way and efficient Collector to Device PULL method is like SNMP poll-response; less-efficient, but less configuration management. Bi-directional streaming with http/2 based transport also providing TLS support https://grpc.io/
Encoding Options Compact GPB Key-Value GPB JSON Encoding (or serialization ) translates data (objects, state) into a format that can be transmitted across the network. When the receiver decodes ( de- serializes ) the data, it has an semantically identical copy of the original data. From https://developers.google.com/protocol-buffers/ Protocol buffers are Google's language-neutral, platform-neutral, extensible mechanism for serializing structured data think XML, but smaller, faster, and simpler. { "node-name: 0/RP0/CPU0 , process-cpu : { { total-cpu-fifteen-minute : 5, total-cpu-five-minute : 6, total-cpu-one-minute : 12 }}} 1: 0/RP0/CPU0 10: 5 11: 6 12: 12 Compact Self-describing Faster to transfer less data More data to transfer More complex to correlate
Architecture Porto ALERTING IPCB COLLECTOR VISUALIZATION DATABASE ALERTING NETWORK Lisboa COLLECTOR ALERTING VISUALIZATION DATABASE NETWORK COLLECTOR VISUALIZATION DATABASE NETWORK
Summary And Key Messages We must change the way we operate networks Automation and programmability are required this days On board management for support, complexity is everywhere nowadays Data Mode-driven is required for configuration, hence model-driven telemetry YANG is the data modeling language for configuration and monitoring Be specific with what you want to push Use OpenConfig models, for consistency, when possible TLDR: use gRPC, dial out, with Key Value protobuf Use Event-driven telemetry when appropriate
Analytics Layer Data collection, processing and visualization
Is the infrastructure ready? https://xrdocs.io/telemetry/tutorials/2018-07-10-is-your-infra-ready-for-telemetry/ Per Process Load DRAM Utilization Disk Network Bandwidth Utilization
Is the infrastructure ready? https://xrdocs.io/telemetry/tutorials/2018-07-10-is-your-infra-ready-for-telemetry/ Per Process Load DRAM Utilization Disk Network Bandwidth Utilization ~1GB Space per hour ~2vCPU CPU E5-2697 v3 @2.60Hz ~1.2GB DDR4 / 2133Mhz ~75Mbps ~90MBps SM1625 800GB 6G 2.5 SAS SSD One Router 350k counters / 5 sec.
Analytics Stack NETWORK
Analytics Stack ALERTING COLLECTOR VISUALIZATION DATABASE NETWORK
Analytics Stack Open-source data collection agent Supports a wide range of input plugins for gathering data from various sources Ideal for handling high-frequency data streams Excels at collecting metrics from systems, sensors, and applications in real-time Can process input data before storing it into a database Allows the collection of metrics from multiple vendors and models
Analytics Stack Time series database that specializes in storing and querying time-stamped data Handles high ingest rates and frequent data updates associated with streaming telemetry Flexible schema that enables adding and modifying measurements on the fly without disrupting data ingestion Using version 2 is strongly recommended, as its new query language is much more versatile
Analytics Stack Data visualization and analytics tool that integrates seamlessly with InfluxDB Provides a user-friendly interface for creating interactive dashboards and exploring time series data Allows monitoring, analyzing, and presenting streaming telemetry data effectively
Performance Measurement Query's sent every 1s (default 3s) Probes completed after 10 query's Timestamps added in hardware PM Query format: RFC 5357 (TWAMP) or RFC 6374 (MPLS) Extracted values: Max, Min, Average, Variance, Query's sent/received Measurement mode: Probes type: One-Way (T2-T1) Interface TX Timestamp T1 TX Timestamp T2 PM Query Packet Two-Way (T4-T1) Endpoint 1 2 Loopback PM Response Packet SR-TE TX Timestamp T4 TX Timestamp T3
Performance Measurement Porto DC 1 Porto DC 2 Guarda Coimbra Castelo Branco Entroncamento Lisboa DC 1 Lisboa DC 2 Evora
But Wait Theres more o.O If SR-TE handles Minimum delay (propagation delay): Minimum delay provides the propagation delay (Fiber length / speed of light) A property of the topology (with awareness of DWDM circuit change) SR-TE (SR Policy or Flex-Algo) can optimize on min delay And SR IGP Flexible Algorithms (Flex-Algo) can: Make a algorithm defined by the operator, on a per-deployment basis Flex-Algo K is then defined as: Algo 0 The minimization of a specified metric: IGP, TE or delay So we can have a dual planar network!! Stay tuned for 2024! Algo 128
Try It Yourself Demo
Try it! No, Really Try it!! TIG MDT Docker Container Separate Container Yang Suite Grafana Visualization Telegraf Collector InfluxDB Storage HTTP Port 8480 gRPC Server Port 57500 gNMI Configuration Port 8086 HTTP Port 3000 https://github.com/DataKnox/Cisco-MDT-TIG-Docker https://github.com/CiscoDevNet/yangsuite
Thank You! FCT|FCCN Network Services Area Jo o Silva joao.silva@fccn.pt Gon alo Lopes goncalo.lopes@fccn.pt Over and Out!


")