The Public Outlook on Child Welfare in the U.S.
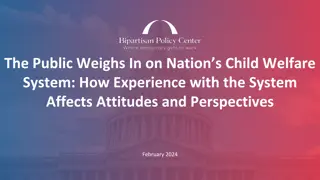
In July 2023, a national survey by Harris Poll and the Bipartisan Policy Center delved into public attitudes toward the U.S. child welfare system. The findings reveal bipartisan consensus on existing challenges and priorities for reform, emphasizing the need to safeguard children and support families. Results indicate Americans' shared concerns across party lines, offering insights for future child welfare initiatives.
Download Presentation

Please find below an Image/Link to download the presentation.
The content on the website is provided AS IS for your information and personal use only. It may not be sold, licensed, or shared on other websites without obtaining consent from the author. Download presentation by click this link. If you encounter any issues during the download, it is possible that the publisher has removed the file from their server.
E N D
Presentation Transcript
The Public Weighs in on Nations Child Welfare System: How Party Affiliation Affects Views and Perceptions January 2024
BPCs Child Welfare Initiative In July 2023, Harris Poll and the Bipartisan Policy Center conducted a groundbreaking national survey to gauge public attitudes toward the U.S. child welfare system following the launch of BPC s Child Welfare Initiative. Building on recent state and federal reform efforts, BPC s new Child Welfare Initiative will tackle key issues including preventing and responding to child neglect and abuse, adoption, foster care, and other areas with the goal of elevating a vision for protecting children and supporting families. Our poll findings show that Americans regardless of party affiliation largely agree on the challenges that the U.S. child welfare system faces, along with what should be prioritized in any future reforms. A A a A 2
Methodology Weighting: Data are weighted to ensure results are projectable to the U.S. general population. Survey results are accurate to within 2.9 percentage points using a 95% confidence level. This credible interval will be wider among subsets of the surveyed population of interest. Some responses may not add to 100% due to rounding or due to selection of responses not included in the chart including "unsure." Audience: 2,013 U.S. adults age 18+ Mode: Conducted online in the U.S. by The Harris Poll on behalf of the Bipartisan Policy Center A Survey Timing: 15 minutes Fielded from June 29 July 19, 2023 Statistical Significance Responses that were statistically significant are denoted with a D, R, or I directly in the chart for the relevant bars. A a A 3
Breakdown of Respondents by Party Affiliation
Regardless of how you may vote, what do you usually consider yourself? A A a A 5
Thinking about your political leanings, how would you describe your political philosophy? A A a A 6
Generally speaking, do you consider yourself to be more of a supporter of Donald Trump or more of a supporter of the Republican Party? A A Responses only for those who identified as Republican. See full crosstabs for all data broken down by Republican leanings. a A 7
Public Perceptions of Child Neglect and Abuse
Key Takeaways on Perceptions of Child Neglect and Abuse Americans of all political affiliations have similar views on why child neglect and abuse occur, with some notable differences: Americans are most likely to suggest that the primary cause of CHILD NEGLECT is parents who don't want to care for their child. [Slide 11] Americans are most likely to suggest that the primary cause of CHILD ABUSE is parents with ill intent or desire to harm their child. [Slide 13] Most Americans agree that acts of child neglect or abuse are intentional or willful on the parent s part as opposed to being the product of unfortunate circumstances. However, Republicans (73%) are more likely than Democrats (65%) or Independents (59%) to believe that child neglect or abuse is intentional or willful. Democrats (36%) are significantly more likely than Republicans (25%) to believe neglect or abuse are the product of unfortunate circumstances. [Slide 14] A A a A 9
Key Takeaways on Perceptions of Child Neglect and Abuse Most Americans believe that parents who have been NEGLECTFUL can provide safe and nurturing care when they receive needed support. Democrats (78%) are more likely than Republicans (69%) to agree with this. [Slide 14, 15] Americans, regardless of political affiliation, are less confident that parents who have been ABUSIVE can provide safe and nurturing care. [Slide 14] A A a A 10
Which of the following factors do you think are significant contributors to why CHILD NEGLECT occurs? A A Responses reflect top five responses for the total population broken down by party affiliation. a A 11
Which of the following factors do you think is typically the primary cause of CHILD NEGLECT? A A Responses reflect top five responses for the total population broken down by party affiliation. a A 12
Which of the following factors do you think are significant contributors to why CHILD ABUSE occurs? A A Responses reflect top five responses for the total population broken down by party affiliation. Respondents could select all that apply. a A 13
Which of the following factors do you think is typically the primary cause of CHILD ABUSE? A A Responses reflect top five responses for the total population broken down by party affiliation. a A 14
Public Perceptions of Parental Neglect and Abuse A A Responses reflect those who strongly agree or somewhat agree. a A 15
Parents who have been NEGLECTFUL can provide safe and nurturing care for their children when they receive needed supports. A A a A 16
I am more understanding of parents involved in cases of child abuse or neglect if I know they are trying to get help or find a way out of their situation. A A a A 17
I think that most acts of child neglect or abuse are intentional or willful on the parent's part. A A a A 18
I think that most acts of child neglect or abuse usually aren't the parent's fault, but rather a product of unfortunate circumstances. A A a A 19
Public Perceptions of the Ideal U.S. Child Welfare System
Key Takeaways on Perceptions of the Ideal Child Welfare System Americans have similar views on the role of government in responding to child neglect and abuse. There are significant differences in views on the proper balance between parents authority and government's interest in ensuring the well-being of children when this question is asked generally. [Slide 23] But Americans agree that both government and community/religious organizations are needed to effectively respond to child neglect and abuse. [Slide 24] Americans agree that the child welfare system should strike a balance between protecting children and strengthening families' ability to care for children, though Democrats (54%) were more likely to lean towards strengthening families than Republicans (46%). [Slide 25] A A a A 21
Key Takeaways on Perceptions of the Ideal Child Welfare System Americans have similar views on how the child welfare system should make key decisions about investigating and responding to neglect and abuse. Americans agree on when a child neglect or abuse investigation should occur: Americans agree on specific circumstances that warrant an investigation. [Slides 27 and 28] Americans agree that agencies should have evidence of harm and not just risk to investigate. [Slide 29] Americans agree that when in doubt, the system should err on the side of investigating reports. [Slide 30] Americans agree that the system should favor keeping children with their family even if it entails an uncertain risk. [Slide 31] A A a A 22
Key Takeaways on Perceptions of the Ideal Child Welfare System Americans have similar views on how child welfare should work when children have been removed from their homes. Americans agree that parents deserve time to address challenges even if it means children remain in foster care longer. [Slide 32 and Slide 33] Americans have similar views on adoption though Republicans (65%) are less likely than Democrats (74%) and Independents (73%) to believe adoptive parents should help children maintain relationships with their biological family. [Slide 34] Americans are extremely supportive of engaging extended family. [Slide 35] A A a A 23
In balancing parents' authority with the government's interest in ensuring the well-being of children, should our country...? Chart shows net (aggregate) of responses on a scale of 1-3 (favor parents' authority) to 4-6 (favor the government's interest in ensuring children's well-being). Net totals reflect that one response was selected on either side of the scale. Respondents could also select not sure, which is not reflected in the chart. A A a A 24
Which best reflects who you think is most effective at responding to concerns of child abuse and neglect? A A a A 25
In an ideal world, which of the following reflects your position on the primary purpose of the child welfare system in this country? Chart shows net (aggregate) of responses on a scale of 1-3 (favor protecting children) to 4-6 (favor strengthening families). Net totals reflect that one response was selected on either side of the scale. Respondents could also select not sure, which is not reflected in the chart. A A a A 26
What is the minimum level of evidence you would need to feel comfortable filing a report where you suspected or knew that a child was being or had been abused or neglected? A A a A 27
Do you believe that any of these scenarios should lead to an investigation by child welfare authorities? A Chart shows responses for child welfare authorities should investigate. Respondents were also given the option of another government of community agency should offer support or not sure. A a A 28
Do you believe that any of these scenarios should lead to an investigation by child welfare authorities? (continued) A Chart shows responses for child welfare authorities should investigate. Respondents were also given the option of another government of community agency should offer support or not sure. A a A 29
In your opinion, which of the following is the minimum amount of evidence that child welfare authorities should need to investigate? A A a A 30
Which most closely reflects your position on how the U.S. child welfare system should decide whether to investigate reports of abuse or neglect? Chart shows net (aggregate) of responses on a scale of 1 (investigate every report) to 6 (only investigate when there is compelling evidence). Net totals reflect that one response was selected on either side of the scale. Respondents could also select not sure, which is not reflected in the chart. A A a A 31
Which most closely reflects your position on how the U.S. foster care system should work when it comes to considering removal of a child? Chart shows net (aggregate) of responses on a scale of 1-3 (with 1 being heavily favor removing child) to 4-6 (with 6 being heavily favor keeping child with family). Net totals reflect that one response was selected on either side of the scale. Respondents could also select not sure, which is not reflected in the chart. A A a A 32
Which most closely reflects your position on how the U.S. foster care system should decide how long parents should be given to address challenges? Chart shows net (aggregate) of responses on a scale of 1-3 (with 1 being heavily favor giving parents more time) to 4-6 (with 6 being heavily favor minimizing time in foster care). Net totals reflect that one response was selected on either side of the scale. Respondents could also select not sure, which is not reflected in the chart. A A a A 33
In your opinion, do you feel that approximately 15 months is the appropriate length of time for parents to show they are addressing issues that interfere with their ability to parent? A A a A 34
Public Perceptions of the U.S. Adoption System A A Responses reflect those who strongly agree or somewhat agree. a A 35
Public Perceptions on the Role of Extended Family A A a A Responses reflect those who strongly agree or somewhat agree. 36
Public Perceptions of How the System Currently Functions
Key Takeaways on Perceptions of How the System Currently Functions Americans largely share common views and concerns of how the system currently functions regardless of party affiliation. Americans have similar levels of familiarity and experience with the system. [Slide 39] Americans have similar perceptions of how well the system currently operates with slightly more positive than negative views of the system. [Slide 41] Americans have similar beliefs about the challenges the child welfare system faces. [Slide 43, 44] A A a A 38
Key Takeaways on Perceptions of How the System Currently Functions However, Democrats (61%) are more likely than Republicans (48%) and Independents (52%) to believe the system perpetuates the oppression of marginalized populations. [Slide 51] Democrats (80%, 72%) are more likely than Republicans (66%, 48%) and Independents (72%, 56%) to believe that decisions to intervene in families are influences by both socioeconomic and racial bias. [Slide 54, 55] A A a A 39
How familiar would you say you are with the child welfare system as a whole? A A a A 40
Which source have you relied on most to inform what you know about the current U.S. child welfare system? A A Responses reflect top five responses for the total population broken down by party affiliation. a A 41
What personal experience, if any, do you have with the U.S. child welfare system? Personal experience with the system includes being a child in the system, being reported to the system as an adult, or having a family member in the system. Experience with the system but not involved themselves includes caring for a child in the system, filing a report on a parent, working for the system, or something else. Respondents were able to select all that apply so responses add to over 100%. A A a A 42
Overall, how positive or negative is your perception of the current U.S. child welfare system? Chart shows net (aggregate) of responses on a scale of 1-3 (with 1 being very negative) to 4-6 (with 6 being very positive). Net totals reflect that one response was selected on either side of the scale. Respondents could also select not sure, which is not reflected in the chart. A A a A 43
Overall, how would you rate how the current U.S. child welfare system functions? Chart shows net of responses on a scale of 1-3 (with 1 being The U.S. child welfare system is an inherently broken system that can't be fixed ), 4 ( The U.S. child welfare system functions the way it was designed to operate ), and 5-7 (with 7 being The U.S. child welfare system is high-functioning ). Net totals reflect that one response was selected on either side of the scale. Respondents could also select not sure, which is not reflected in the chart. A A a A 44
How much of a challenge do you see the following when it comes to the obstacles that the current U.S. child welfare system faces? A Responses for somewhat of a challenge and a significant challenge. Respondents could also answer with not at all a challenge. A a A 45
How much of a challenge do you see the following when it comes to the obstacles that the current U.S. child welfare system faces? (continued) A Responses for somewhat of a challenge and a significant challenge. Respondents could also answer with not a challenge at all. A a A 46
How much of a challenge do you see limited funding being when it comes to the obstacles that the current U.S. child welfare system faces? A A a A 47
How much of a challenge do you see racial biases being when it comes to the obstacles that the current U.S. child welfare system faces? A A a A 48
Public Perceptions of How the U.S. Child Welfare System Works A A Responses for those who strongly agree and somewhat agree. a A 49
The child welfare system only gets attention when something bad happens. A A a A 50
