The Nature of Probability and Statistics
Branches of statistics, the concept of data, and the selection of samples. It explains variables and data sets, and the difference between descriptive and inferential statistics.
Uploaded on | 19 Views

The Nature of Probability and Statistics
PowerPoint presentation about 'The Nature of Probability and Statistics'. This presentation describes the topic on Branches of statistics, the concept of data, and the selection of samples. It explains variables and data sets, and the difference between descriptive and inferential statistics.. Download this presentation absolutely free.
Presentation Transcript
The nature of probability The nature of probability and statistics and statistics
Most people become familiar with probability and statistics through radio, television, newspapers, and magazines. For example Based on the 2000 census, 40.5 million households have two vehicles. The average cost of a wedding is nearly 10$. Women how eat fish once a week are 29% less likely to develop heart disease. The median salary for men with a bachelor s degree is 750 Id.
Statistics is the science of conducting studies to collect, organize, summarize, analyze, and draw conclusions from data In this lecture we try to answer the following questions: What are the branches of statistics? What are data? How are samples selected?
To gain knowledge about something, statisticians collect information for variables, which describe the event. A variable is a characteristic or attributes that can assume different values Data are the values (measurements or observations) that the variable can assume. Variables whose values are determined by chance are called random variable
A collection of data values forms a data set. Each value in the data set is called a data value or a datum. The body of knowledge of statistics is sometimes divided into two main areas, depending on how data are used Descriptive Inferential
Descriptive statistics consists of the collection, organization, summarization, and presentation of data Consider the national census conducted by the Iraqi governorate every 10 years. Results of this census give the average age, income, and other characteristics of the Iraqi population. To obtain this information, the census bureau must have some means to collect relevant data. Once data are collected, the bureau must organize and summarize them. Finally, the bureau needs a means of presenting the data in some meaningful form such as charts, graphs, or tables.
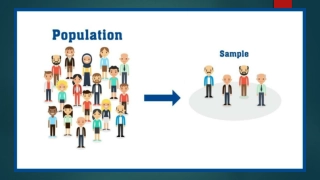
The second area of statistics is called inferential statistics. Here, the statisticians tries to make inference from sample to population. Inferential statistics uses probability, ie., the chance of an event occurring . It is important to distinguish between a sample and a population A population consists of all subjects (human or alternative) that are being studied Most of the time, due to the expense, time, size of population, medical concerns, etc., it is not possible to use the entire population for a statistical study; therefore, researcher use samples
A sample is a group of subjects selected from a population. Inferential statistics consists of generalizing from samples to populations, performing estimation and hypothesis tests, determining relationships among variables, and making predictions.
Variables and data types Data Quantitative Qualitative Discrete Continuous
Example Gender : male or female Religious preference Geographic location Age Heights Weights Body temperature
Discrete variables can assigned values such as 0, 1, 2, 3 and are said to be countable. Number of children in a family. Number of students in a classroom Number of calls received by a switchboard operator each day for a month. Continuous variables can assume all values in an interval between any two specific values. Temperature River discharge Length Weight
Chapter Quiz: Determine whether each statement is true or False. If the statement is false, explain why? 1. Probability is used as a basis for inferential statistics. 2. The variable of age is an example of a qualitative variable. 3. The weight of pumpkins is considered to be a continuous variable.
Chapter Quiz: Use the best answer to complete these statements. 1. Two major branches of statistics are and 2. The group of all subjects under a study is called 3. A group of subjects selected from the group of all subjects under study is called . 4. Three reasons why samples are used in statistics are ...., .., , and ..
Chapter Quiz: Classify each variable as discrete or continuous The time it takes to drive to work. The number of credit card a person has A number of employees working in a large department store The amount of drag injected into a rat The number of cars stolen each week in a large city.