2014 Cost Report Residential Staffing Data Analysis
This analysis provides insights into staffing schedules, vacancy rates, turnover rates, and wage data from the 2014 Cost Report by the Department of Social and Health Services Management. It includes breakdowns by county and position type, highlighting key trends and challenges in the residential staffing sector.

Download Presentation

Please find below an Image/Link to download the presentation.
The content on the website is provided AS IS for your information and personal use only. It may not be sold, licensed, or shared on other websites without obtaining consent from the author.If you encounter any issues during the download, it is possible that the publisher has removed the file from their server.
You are allowed to download the files provided on this website for personal or commercial use, subject to the condition that they are used lawfully. All files are the property of their respective owners.
The content on the website is provided AS IS for your information and personal use only. It may not be sold, licensed, or shared on other websites without obtaining consent from the author.
E N D
Presentation Transcript
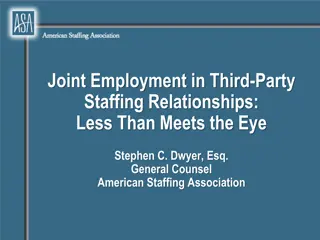
2014 Cost Report Residential Staffing Schedule Department of Social and Health Services Management Services Division Office of Rates Management Ken Callaghan, Chief
Responses by County Entry Level Vacancy Rate by County Entry Level Turnover Rate By County County Type Code 1 Number of Providers by County 0 Rec'vd by Couinty 0 % by County % by total Rec'vd Adams NON-MSA Asotin MSA 2 1 0 9.3% 37.2% Benton MSA 3 3 1 33% 1% 3.6% 28.5% Chelan MSA 4 2 2 100% 2% 9.4% 37.5% Clallam NON-MSA 5 3 1 33% 1% 6.0% 56.5% Clark MSA 6 7 6 86% 5% Columbia NON-MSA 7 0 0 1.7% 39.1% Cowlitz MSA 8 3 3 100% 2% Douglas MSA 9 0 0 Ferry NON-MSA 10 0 0 Franklin MSA 11 0 0 Garfield NON-MSA 12 0 0 23.7% 67.1% Grant NON-MSA 13 2 2 100% 2% 8.0% 34.0% Grays Harbor NON-MSA 14 3 3 100% 2% 3.9% 49.0% Island MSA 15 4 2 50% 2% 15.6% 32.8% Jefferson NON-MSA 16 1 1 100% 1% 8.6% 32.0% King KING 17 47 31 66% 25% 4.5% 30.7% Kitsap MSA 18 4 3 75% 2% 6.0% 44.0% Kittitas NON-MSA 19 2 1 50% 1% Klickitat NON-MSA 20 0 0 5.4% 67.6% Lewis NON-MSA 21 2 2 100% 2% Lincloln NON-MSA 22 0 0 5.5% 40.7% Mason MSA 23 1 1 100% 1% 7.7% 38.5% Okanogan NON-MSA 24 1 1 100% 1% Pacific NON-MSA 25 0 0 Pend Oreille NON-MSA 26 0 0 11.3% 37.7% Pierce MSA 27 20 17 85% 14% San Juan NON-MSA 28 0 0 Skagit MSA 29 3 0 Skamania MSA 30 0 0 15.4% 57.5% Snohomish MSA 31 14 8 57% 7% 10.6% 46.7% Spokane MSA 32 17 13 76% 11% Stevens NON-MSA 33 0 0 10.2% 57.4% Thurston MSA 34 8 6 75% 5% Wahkiakum NON-MSA 35 0 0 0.0% 34.2% Walla Walla NON-MSA 36 3 1 33% 1% 4.3% 55.8% Whatcom MSA 37 9 7 78% 6% 3.5% 68.2% Whitman NON-MSA 38 2 2 100% 2% 4.6% 42.7% Yakima MSA 39 6 5 83% 4% 8.3% 42.1% 168 119 71% 98%
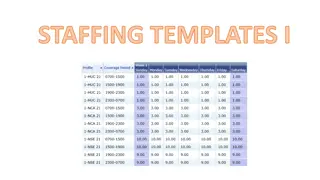
Wage, Vacancy & Turnover Data % by total Rec'vd 30% 25% 20% 15% 10% 5% 0% Ferry Okanogan Pend Oreille Spokane Yakima Douglas Grant Island Skagit Mason Lincloln Pacific Whatcom Benton Chelan Garfield Kittitas Grays Harbor King Lewis San Juan Franklin Klickitat Skamania Whitman Clark Jefferson Pierce Snohomish Thurston Walla Walla Kitsap Columbia Clallam Cowlitz Stevens Wahkiakum
Wage, Vacancy & Turnover Data RESIDENTIAL STAFFING SURVEY - 2014 Wage, Vacancy & turnover data Hourly Wages Reported Hourly Wages Reported (mean) (mean) Note: The following data Note: The following data includes includes data from the SOLA programs data from the SOLA programs Hourly Wage Range Hourly Wage Range Number of Staff Positions Total Staff Percent of Group Entry Level Two Year Low High Vacancy Rate Turnover Rate Entry Level 7,771 87.1% $10.45 $11.12 $9.32 $13.32 8.3% 41.8% 1st Line Supervisors 610 6.8% $13.08 $14.05 $11.00 $17.71 3.4% 21.8% Program Managers 294 3.3% $16.92 $18.68 $10.25 $34.13 1.0% 11.6% Specialists 172 1.9% $18.32 $18.63 $10.00 $55.00 1.7% 15.7% Nurses 80 0.9% $25.10 $24.48 $17.00 $40.00 15.3% 50.6% Average Vacancy & Turnover Total No. Positions 8,927 100.0% 7.7% 39.0% Breakdown of Employees Breakdown of Employees that Left by Position Type that Left by Position Type Number of Vacant Positions Number of Vacant Positions Entry Level 644 94.3%Entry Level 3,250 93.3% 1st Line Supervisors 21 3.1%1st Line Supervisors 133 3.8% Program Managers 3 0.4%Program Managers 34 1.0% Specialists 3 0.4%Specialists 27 0.8% Nurses 12 1.8%Nurses 41 1.2% Total Vacant Positions 683 100.0%Total Employees Left 3,485 100.0% NOTE: This information includes Contracted Providers and SOLA The cost report certifies the accurate reporting of information.
Wage, Vacancy & Turnover Data RESIDENTIAL STAFFING SURVEY - 2014 Wage, Vacancy & turnover data Note: The following data Note: The following data does not programs programs does not include include data from the data from the SOLA SOLA Hourly Wages Reported Hourly Wages Reported (mean) (mean) Hourly Wage Range Hourly Wage Range Number of Staff Positions Total Staff Percent of Group Entry Level Two Year Low High Vacancy Rate Turnover Rate Entry Level 7,660 87.0% $10.41 $11.06 $9.32 $12.25 8.3% 42.1% 1st Line Supervisors 601 6.8% $12.97 $13.94 $11.00 $17.71 3.5% 22.1% Program Managers 292 3.3% $16.92 $18.68 $10.25 $34.13 1.0% 11.6% Specialists 170 1.9% $18.09 $18.41 $10.00 $55.00 1.8% 15.9% Nurses 79 0.9% $25.09 $24.35 $17.00 $40.00 15.4% 51.3% Average Vacancy & Turnover Total No. Positions 8,802 100.0% 7.7% 39.3% Breakdown of Employees Breakdown of Employees that Left by Position Type that Left by Position Type Number of Vacant Positions Number of Vacant Positions Entry Level 637 94.2%Entry Level 3,228 93.2% 1st Line Supervisors 21 3.1%1st Line Supervisors 133 3.8% Program Managers 3 0.4%Program Managers 34 1.0% Specialists 3 0.4%Specialists 27 0.8% Nurses 12 1.8%Nurses 41 1.2% Total Vacant Positions 676 100.0%Total Employees Left 3,463 100.0% NOTE: This information includes ONLY Contracted Providers The cost report certifies the accurate reporting of information
RESIDENTIAL STAFFING SURVEY - 2014 Wage, Vacancy & turnover data Hourly Wages Reported Hourly Wages Reported (mean) (mean) Note: The following data Note: The following data includes only includes only data from the data from the SOLA SOLA programs programs Hourly Wage Range Hourly Wage Range Number of Staff Positions Total Staff Percent of Group Entry Level Two Year Low High Vacancy Rate Turnover Rate Entry Level 111 88.8% $13.32 $14.28 $13.32 $13.32 6.3% 19.8% 1st Line Supervisors 9 7.2% $17.60 $18.94 $17.60 $17.60 0.0% 0.0% No data reported No data reported No data reported No data reported Program Managers 2 1.6% 0.0% 0.0% Specialists 2 1.6% $23.07 $24.22 $23.07 $23.07 0.0% 0.0% Nurses 1 0.8% $25.25 $26.52 $25.25 $25.25 0.0% 0.0% Average Vacancy & Turnover Total No. Positions 125 100.0% 5.6% 17.6% Breakdown of Employees Breakdown of Employees that Left by Position Type that Left by Position Type Number of Vacant Positions Number of Vacant Positions Entry Level 7 100.0%Entry Level 22 100.0% 1st Line Supervisors - 0.0%1st Line Supervisors - 0.0% Program Managers - 0.0%Program Managers - 0.0% Specialists - 0.0%Specialists - 0.0% Nurses - 0.0%Nurses - 0.0% Total Vacant Positions 7 100.0%Total Employees Left 22 100.0%
Wage Data For All Regions Combined Program Managers Program Managers Nurses after 2 years Supervisors after 2 Supervisors Wages Entry Level after 2 Specialists after 2 Entry Level Wages Specialists Wages Nurses Wages after 2 years Wages years years years Lowest Reported Wage 9.32 9.32 10.25 12.00 11.00 11.50 10.00 10.50 17.00 18.00 Highest Reported Wage Average of All Wages Median 12.25 10.41 10.25 13.68 11.06 12.50 34.13 16.92 16.18 34.13 18.68 16.00 17.71 12.97 24.00 19.38 13.94 11.00 55.00 18.09 14.00 55.00 18.41 17.74 40.00 25.09 17.20 40.00 24.35 23.00 60.00 50.00 40.00 30.00 20.00 10.00 0.00 Entry Level Wages Entry Level after 2 years Program Managers Wages Lowest Reported Wage Program Managers after 2 years Supervisors Wages Supervisors after 2 years Specialists Wages Specialists after 2 years Nurses Wages Nurses after 2 years Highest Reported Wage Average of All Wages
2-Year Wages By Region & Type Program Manager Start Program Manager Two Year Entry Level Start First Line Start Specialists Start Nurses Start Entry Two Year First Line Two Year Specialists Two Year Nurses Two Year Avg Wage by Type 1N 1S 2N 2S 3N 3S 10.23 9.83 10.57 10.83 10.21 10.21 12.93 13.94 12.50 13.67 12.50 12.64 16.99 14.52 12.37 15.86 13.76 16.29 26.33 17.14 0.00 11.31 9.98 14.75 20.00 10.96 10.36 11.28 11.58 10.66 10.83 14.15 14.44 13.07 14.76 13.34 13.56 18.57 15.16 13.38 17.41 15.38 18.85 26.67 18.33 4.13 12.65 10.36 17.60 20.00 0.00 19.00 22.40 22.33 40.00 #DIV/0! 18.00 23.19 23.50 36.33 45.00 40.00 35.00 30.00 1N 25.00 1S 2N 20.00 2S 15.00 3N 3S 10.00 5.00 0.00 Entry Level Start First Line Start Program Manager Start Specialists Start Nurses Start Entry Two Year First Line Two Year Program Manager Two Year Specialists Two Year Nurses Two Year
Average Wage By Region 45.00 Average Wage Reported 40.00 1N 1S 2N 2S 3N 3S 35.00 30.00 25.00 20.00 15.00 10.00 5.00 0.00 Program Manager Start 16.99 14.52 12.37 15.86 13.76 16.29 Program Manager Two Year 18.57 15.16 13.38 17.41 15.38 18.85 Entry Level Start Entry Two Year First Line Start First Line Two Year Specialists Start Specialists Two Year Nurses Start Nurses Two Year 1N 1S 2N 2S 3N 3S 10.23 9.83 10.57 10.83 10.21 10.21 10.96 10.36 11.28 11.58 10.66 10.83 12.93 13.94 12.50 13.67 12.50 12.64 14.15 14.44 13.07 14.76 13.34 13.56 26.33 17.14 0.00 11.31 9.98 14.75 26.67 18.33 4.13 12.65 10.36 17.60 20.00 0.00 18.00 23.19 23.50 36.33 20.00 0.00 19.00 22.40 22.33 40.00