2014 Massachusetts Employer Health Insurance Survey Chart
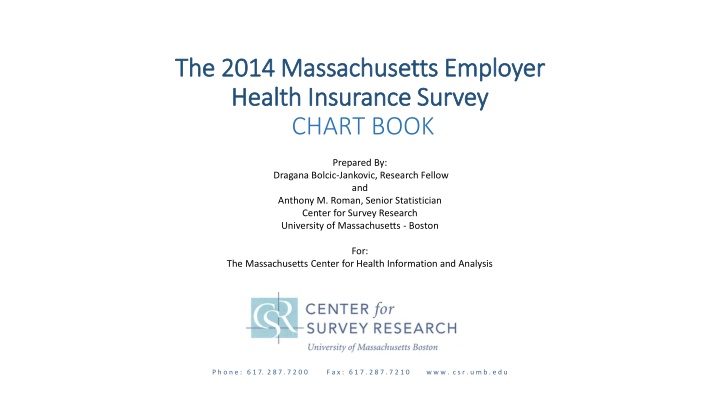
The 2014 Massachusetts Employer Health Insurance Survey Chart Book was prepared by Dragana Bolcic-Jankovic, Research Fellow, and Anthony M. This comprehensive survey provides valuable insights into employer-provided health insurance in Massachusetts in 2014, offering crucial data and analysis for policymakers, healthcare professionals, and businesses seeking to understand the landscape of health insurance coverage in the state.
Download Presentation

Please find below an Image/Link to download the presentation.
The content on the website is provided AS IS for your information and personal use only. It may not be sold, licensed, or shared on other websites without obtaining consent from the author.If you encounter any issues during the download, it is possible that the publisher has removed the file from their server.
You are allowed to download the files provided on this website for personal or commercial use, subject to the condition that they are used lawfully. All files are the property of their respective owners.
The content on the website is provided AS IS for your information and personal use only. It may not be sold, licensed, or shared on other websites without obtaining consent from the author.
E N D
Presentation Transcript
The 2014 Massachusetts Employer The 2014 Massachusetts Employer Health Insurance Survey Health Insurance Survey CHART BOOK Prepared By: Dragana Bolcic-Jankovic, Research Fellow and Anthony M. Roman, Senior Statistician Center for Survey Research University of Massachusetts - Boston For: The Massachusetts Center for Health Information and Analysis w w w . c s r . u m b . e d u P h o n e : 6 1 7. 2 8 7 . 7 2 0 0 F a x : 6 1 7 . 2 8 7 . 7 2 1 0
Massachusetts Employer Survey Methodology The Massachusetts Employer Survey (MES) is conducted by the Center for Survey Research at the University of Massachusetts at Boston, on behalf of the Center for Health Information and Analysis. This survey occurred on a biennial basis since 2001, annually from 2009 through 2011, and again in 2014. The 2014 survey sample was drawn from Dun & Bradstreet employer listings for all Massachusetts employers excluding federal and state government employers and worksites with less than three employees. An employer worksite, defined as a particular site or location, is the designated primary sampling unit. The survey sample is stratified into five groups based on employer size. The MES is conducted by mail with a web-based option. Questionnaires were mailed out in January 2014 to 1,582 worksites. The survey was returned from 601 employers, a 42 percent response rate among eligible employers. The majority of worksites chose to respond by mail (75 percent), and 25 percent of respondents used the web-based option. The survey has relied on the same survey questionnaire design with modifications to questions each year. In 2009, a number of questions were modified or added to reflect the growing complexity of insurance market products such as health reimbursement arrangements and health savings accounts, and to gather information regarding some Massachusetts health care reform activities. In 2014, a number of questions were again added or modified given the implementation of the Affordable Care Act. Because of a change in sample stratification methodology in 2009, comparisons of estimates for the smallest size firms should be used with caution. Beginning in 2009, the smallest firms included in the sample are firms with three employees. In prior years, firms with two employees were also included. This change was made to make results more comparable with national survey findings. Throughout these charts, when the term small employers is used, it refers to either those with 2-10 or 3-10 employees depending on the year. Additional information on the MES is available at www.mass.gov/chia.
Massachusetts Employer Survey Offer Rates The employer offer rate is the percentage of surveyed worksites that offered health insurance to at least some employees during the survey period.
Employers Offering Health Insurance: Massachusetts Compared to the Nation (2001-2014) MA US 77% 76% 76% 76% 72% 70% 69% 69% 68% 68% 66% 60% 59% 59% 60% 55% 2001 2003 2005 2007 2009 2010 2011 2014 Source: Massachusetts Employer Survey (MES), Kaiser/HRET Survey of Employer Sponsored Benefits
Massachusetts Employers Offering Health Insurance by Employer Size (2007-2014) 99% 99% 98% 98% 97% 2007 2009 2010 2011 2014 92% 91% 90% 89% 88% 77% 76% 76% 76% 72% 69% 69% 68% 67% 67% All Employers Small Employers*1 11-50 Employees*2 51+ Employees*3 *1 See Survey Methodology description. Small employer is defined as 3-10 employees for 2009 onwards and 2-10 employees for 2007 and earlier. *2 Except for 2009, within each year, rates presented are significantly higher than corresponding rates for small employers at the 95% level. *3 Within each year, rates are significantly higher than corresponding rates for both 11-50 employees and small employers at the 95% level. Source: Massachusetts Employer Survey (MES)
Massachusetts Employers Offering Health Insurance to Spouses (2005-2014) 2005 2007 2009 2010 2011 2014 93% 91% 91% 89% 88% 87% 78% 73% 71% 68% 59% 52% Opposite-Sex Spouses Same-Sex Spouses Note: Estimates based on small subgroups of the overall population have larger variances, making point estimates less precise. Percentages are of those employers who offer health insurance. Source: Massachusetts Employer Survey (MES)
Massachusetts Employers Offering Health Insurance to Unmarried Domestic Partners (2001-2014) 2001 2007 2009 2010 2011 2014 49% 47% 46% 45% 42% 40% 36% 35% 35% 32% 32% 26% Opposite-Sex Domestic Partners Same-Sex Domestic Partners Note: Estimates based on small subgroups of the overall population have larger variances, making point estimates less precise. Percentages are of those employers who offer health insurance. Source: Massachusetts Employer Survey (MES)
Massachusetts Employers Offering Health Insurance to Part-Time Employees (2014) Offer to Full Time and Non- Full Time 25% Offer Only to Full Time 75% Note: Percentages are of those employers who offer health insurance. Source: 2014 Massachusetts Employer Survey (MES)
Massachusetts Employers Offering Health Insurance to Part-Time Employees by Percent of Part-Time Employees (2014) Under the median percent of part-time employees Over or equal to the median percent of part-time employees 99% 98% 96% 90% 84% 84% 63% 54% All*1 3-10 Employees*1 11-50 Employees*2 51+ Employees*2 Note: Estimates based on small subgroups of the overall population have larger variances, making point estimates less precise. Percentages are of those employers who offer health insurance. *1 Under median percentage significantly greater than over median percentage at 95% level *2 Over median percentage significantly greater than comparable percentage reported for 3-10 Employee group at 95% level Source: 2014 Massachusetts Employer Survey (MES)
Massachusetts Employers Offering Health Insurance by Industry (2014) 100% 90% 89% 80% 65% 64% 62% 56% Wholesale Trade (n=29) Services (n=300) Finance and Insurance (n=54) Construction (n=35) Transportation and Manufacturing (n=55) Retail Trade (n=83) Agriculture and Fishing (n=14) Communication (n=19) Note: Estimates based on small subgroups of the overall population have larger variances, making point estimates less precise. Industry categories follow the North American Industry Classification System (NAICS), the standard used by federal statistical agencies. Source: 2014 Massachusetts Employer Survey (MES)
Massachusetts Employers Offering Health Insurance by Region (2009-2014) 2009 2010 2011 2014 92% 83% 82% 82% 82% 82% 81% 81% 78% 77% 76% 76% 75% 75% 75% 73% 73% 73% 72% 72% 71% 69% 68% 64% Boston Metrowest Western Central Southeast Northeast Source: Massachusetts Employer Survey (MES)
Employer Offered Benefits by Employer Size (2014) All 3-10 11-50 Employees 51+ Employers Employees Employees 73.5%*1 96.0%*2 Offers Dental Insurance 65.2% 57.3% 80.8%*2 Offers Vision Insurance 51.8% 45.1% 59.1% 96.0%*2 Offers Life Insurance 60.4% 49.1% 73.0% 72.8%*1 95.6%*2 Offers Disability Insurance 62.3% 53.2% 80.5%*1 95.0%*2 Offers Retirement/Pension Benefits 71.5% 64.8% 64.2%*2 Offers Long-term Care Insurance 32.6% 25.3% 42.9% Note: Percentages are based on all employers, including those that do not offer health insurance. *1 significantly different from 3-10 employee group *2 significantly different from both 3-10 and 11-50 employee groups Statistical significance at 95% level. Source: Massachusetts Employer Survey (MES)
Employer Offerings by Employer Size (2014) All 3-10 11-50 Employees 51+ Employers Employees Employees 26.7%*1 Employer offering Health Reimbursement Account (HRA) 16.0% 11.1% 23.2% 24.1%*1 Health Savings Account (HSA) 14.4% 9.9% 20.9% 95.8%*1 98.3%*1 Offers to Opposite sex spouses of employees 88.0% 82.4% 88.9%*1 93.6%*1 Offers to Same sex spouses of employees 78.3% 70.4% Offers to Opposite sex unmarried partners of employees 45.1% 39.4% 56.1% 49.0% Offers to Same sex unmarried partners of employees 47.5% 42.0% 58.8% 49.0% 95.2%*1 100%*2 Offers to Dependent children of employees 88.6% 83.5% Note: Percentages are of those employers who offer health insurance. *1 significantly different from 3-10 employee group *2 significantly different from both 3-10 and 11-50 employee groups Statistical significance at 95% level. Source: Massachusetts Employer Survey (MES)
Massachusetts Employers Reasons for Not Offering Health Insurance (2009-2014) Reason 2009 2010 2011 2014 Premiums too high 91% 92% 88% 89% Firm is too small 91% 88% 89% 84% Financial status prohibits offering insurance/too expensive 89% 89% 83% --- Employees generally covered elsewhere 88% 82% 86% 93% Employees have access to insurance through Commonwealth Health Connector s insurance plans or MassHealth 60% 76% 63% 78% Most employees are part-time/temporary/contracted employees 56% 65% 60% 59% Can attract good employees without offering 55% 46% 59% 76% Administrative hassle 42% 49% 40% 53% Turnover too great 25% 36% 37% 34% Organization too newly established 11% 15% 19% 19% Note: Reasons are not mutually exclusive. Estimates based on small subgroups of the overall population have larger variances, making point estimates less precise. Source: 2014 Massachusetts Employer Survey (MES)
Massachusetts Employer Survey Take-Up Rates The employee take-up rate is the percentage of employees at a worksite that subscribe to their employer s offered health insurance plan(s). Not all employees at a worksite may be eligible for benefits (e.g. part-time, temporary workers, contract employees, and in-waiting period employees).
Massachusetts Eligible Employee Median Take-Up Rates by Employer Size for Employers Offering Health Insurance (2007-2014) 2007 2009 2010 2011 2014 81% 80% 80% 80% 80% 80% 78% 78% 77% 75% 75% 75% 75% 75% 74% 74% 74% 73% 72% 72% All Small Employers* 11-50 Employees 51+ Employees *See Survey Methodology description. Small employer is defined as 3-10 employees for 2009 onwards and 2-10 employees for 2007 and earlier. Note: Estimates based on small subgroups of the overall population have larger variances, making point estimates less precise. Take-up rates displayed are medians. Source: Massachusetts Employer Survey (MES)
Massachusetts Eligible Employee Median Take-Up Rates by Employer Percent of Part-Time Employees (2014) Under the median percent of part-time employees Over or equal to the median percent of part-time employees 75% 75% 75% 74% 67% 67% 67% 65% All 3-10 Employees 11-50 Employees 51+ Employees Note: The median percent of part-time employees for all employers was 23% in 2014. It was 26% for firms with 3-10 employees, 18% for firms with 11-50 employees, and 9% for firms with 51 or more employees. Estimates based on small subgroups of the overall population have larger variances, making point estimates less precise. Take-up rates displayed are medians. Source: 2014 Massachusetts Employer Survey (MES)
Massachusetts Eligible Employee Median Take-Up Rates by Industry (2014) 75% 75% 73% 70% 67% 65% 64% 33% Wholesale Trade (n=25) Services (n=208) Finance and Insurance (n=46) Construction (n=28) Transportation and Manufacturing (n=46) Retail Trade (n=44) Agriculture and Fishing (n=8) Communication (n=15) Note: Estimates based on small subgroups of the overall population have larger variances, making point estimates less precise. Industry categories follow the North American Industry Classification System (NAICS), the standard used by federal statistical agencies. Take-up rates displayed are medians. Source: 2014 Massachusetts Employer Survey (MES)
Median Employee Take-Up Rates in Massachusetts (2001-2014) 100% 85% 80% 80% 78% 78% 77% 75% 80% 73% 67% 63% 63% 60% 57% 60% 54% 56% 50% Eligible Employees* 40% All Employees* 20% 0% 2001 2003 2005 2007 2009 2010 2011 2014 *Between 2011 and 2014, there were significant increases in the proportion of benefit eligible employees, from 65% to 77%. Although there is a slight decrease of the median take-up rate from 77% to 73% among benefit-eligible employees, the overall take-up rate still increased from 50% to 56%. The median take-up rate from this survey is not meant as a rate for employees from all employers from across the state. Source: Massachusetts Employer Survey
Massachusetts Employer Survey Premiums
Average Monthly Health Insurance Premiums for Individual Plans in Massachusetts and the United States, 2005, 2011 and 2014 MA US $535 $519 $502 $452 $378 $335 2005 2011 2014 Source: Massachusetts Employer Survey (MES), Kaiser/HRET Survey of Employer Sponsored Benefits
Median Monthly Total Premium for Individual Health Insurance Plans in Massachusetts (2001-2014) $544 $500 $479 $442 $412 $365 $310 $251 2001 2003 2005 2007 2009 2010 2011 2014 Note: Calculations are based on the reported monthly total plan premiums. Premium growth volatility from year to year due to changes in demographics of enrolled employees can be especially significant for small groups. Source: Massachusetts Employer Survey (MES)
Median Monthly Total Premium for Individual Health Insurance Plans by Firm Size (2001-2014) 50 or Fewer Employees 51+ Employees $567 $544 $500 $504 $479 $478 $442 $418 $426 $406 $365 $350 $312 $294 $254 $235 2001 2003 2005 2007 2009 2010 2011 2014 Note: Calculations are based on the reported monthly total plan premiums. Premium growth volatility from year to year due to changes in demographics of enrolled employees can be especially significant for small groups. Source: Massachusetts Employer Survey (MES)
Median Monthly Total Premium for Individual Health Insurance Plans by Employer Size (2009-2014) 2009 2010 2011 2014 $567 $544 $544 $534 $504 $504 $500 $490 $489 $479 $478 $442 $456 $451 $431 $426 All Firms 3-10 Employees 11-50 Employees 51+ Employees Note: Calculations are based on the reported monthly total plan premiums. Source: Massachusetts Employer Survey (MES)
Massachusetts Employer Percentage Contribution to Individual Plan Premiums (2001-2014) 82% 80% 78% 77% 75% 75% 72% 72% 2001 2003 2005 2007 2009 2010 2011 2014 Note: Calculations are based on the median employer percentage contribution. Source: Massachusetts Employer Survey (MES)
Massachusetts Median Monthly Employee Contribution to Individual Plan Premiums (2001-2014) $154 $120 $119 $116 $101 $80 $60 $40 2001 2003 2005 2007 2009 2010 2011 2014 Note: Calculations are based on the reported monthly employee contributions to plan premiums. Source: Massachusetts Employer Survey (MES)
Massachusetts Median Monthly Employee Contribution to Individual Premiums by Firm Size (2001-2014) 2001 2003 2005 2007 2009 2010 2011 2014 $155 $146 $120 $120 $117 $116 $115 $111 $101 $100 $88 $78 $61 $60 $48 $40 50 or Fewer Employees 51 or More Employees Note: Calculations are based on the reported monthly employee contributions to plan premiums. Source: Massachusetts Employer Survey (MES)
Median Employer/Employee Contribution to Individual Health Insurance Plan Premiums (2001-2014) $600 $544 $500 $479 $500 $442 $154 $412 $119 $120 $365 $400 $116 $101 $310 $80 $300 Employee Contribution $251 $60 Employer Contribution $40 $200 $390 $381 $359 $326 $311 $285 $250 $211 $100 $0 2001 2003 2005 2007 2009 2010 2011 2014 Note: The employer median contribution dollars are extrapolated from the reported median total premium and the reported median employee contribution. Source: Massachusetts Employer Survey (MES)
Average Monthly Health Insurance Premiums for Family Plans in Massachusetts and the United States, 2005, 2011 and 2014 MA US $1,482 $1,403 $1,384 $1,256 $977 $907 2005 2011 2014 Source: Massachusetts Employer Survey (MES), Kaiser/HRET Survey of Employer Sponsored Benefits
Massachusetts Median Monthly Total Premium for Family Health Insurance Plans (2001-2014) $1,479 $1,371 $1,262 $1,189 $1,080 $950 $819 $650 2001 2003 2005 2007 2009 2010 2011 2014 Note: Calculations are based on the reported monthly total plan premiums. Source: Massachusetts Employer Survey (MES)
Massachusetts Median Monthly Total Premium for Family Health Insurance Plans by Firm Size (2001-2014) $1,521 $1,475 50 or Fewer Employees 51+ Employees $1,371 $1,381 $1,256 $1,281 $1,194 $1,159 $1,068 $1,099 $950 $958 $819 $823 $650 $633 2001 2003 2005 2007 2009 2010 2011 2014 Note: Calculations are based on the reported monthly total plan premiums. Source: Massachusetts Employer Survey (MES)
Massachusetts Median Monthly Total Premium for Family Health Insurance Plans by Employer Size (2009-2014) 2009 2010 2011 2014 $1,521 $1,505 $1,479 $1,464 $1,383 $1,381 $1,371 $1,367 $1,281 $1,273 $1,262 $1,200 $1,189 $1,233 $1,159 $1,148 All Firms 3-10 Employees 11-50 Employees 51+ Empoloyees Note: Calculations are based on the reported monthly total plan premiums. Source: Massachusetts Employer Survey (MES)
Massachusetts Employer Percentage Contribution to Family Plan Premiums (2001-2014) 75% 75% 75% 75% 70% 70% 68% 68% 2001 2003 2005 2007 2009 2010 2011 2014 Note: Calculations are based on the median employer percentage contribution. Source: Massachusetts Employer Survey (MES)
Massachusetts Median Monthly Employee Contribution to Family Plan Premiums (2001-2014) $456 $384 $372 $350 $298 $239 $215 $172 2001 2003 2005 2007 2009 2010 2011 2014 Note: Calculations are based on the reported monthly employee contributions to plan premiums. Source: Massachusetts Employer Survey (MES)
Massachusetts Median Monthly Employee Contribution to Family Premiums by Firm Size (2001-2014) 2001 2003 2005 2007 2009 2010 2011 2014 $460 $422 $387 $384 $382 $355 $350 $335 $298 $278 $269 $237 $224 $195 $174 $161 50 or Fewer Employees 51 or More Employees Note: Calculations are based on the reported monthly employee contributions to plan premiums. Source: Massachusetts Employer Survey (MES)
Median Employer/Employee Contribution to Family Health Insurance Plan Premiums (2001-2014) $1,800 $1,479 $1,500 $1,371 $1,262 $1,189 $456 $1,200 $1,080 $384 $372 $950 $350 $819 $298 $900 Employee Contribution $239 $650 Employer Contribution $215 $600 $172 $1,023 $987 $890 $839 $782 $711 $300 $604 $478 $0 2001 2003 2005 2007 2009 2010 2011 2014 Note: The employer median contribution dollars are extrapolated from the reported median total premium and the reported median employee contribution. Source: Massachusetts Employer Survey (MES)
Massachusetts Median Copayment/Coinsurance by Service Type and Year (2001-2014) Reason 2001 2003 2005 2007 2009 2010 2011 2014 Physician Office Visit $10 $15 $15 $15 $20 $20 $20 $20 Emergency Room $30 $50 $50 $50 $75 $100 $100 $100 Inpatient Hospitalization Coinsurance --- $50 $250 $250 $250 $300 $250 $250 Outpatient Mental Health --- $15 $15 $20 $20 $20 $20 $20 Tier 1 Drugs $8 $10 $10 $10 $10 $15 $15 $15 Tier 2 Drugs $15 $20 $25 $25 $25 $30 $30 $30 Tier 3 Drugs $25 $35 $40 $45 $45 $50 $50 $50 Source: Massachusetts Employer Survey (MES)
Massachusetts Employer Survey Additional Charts
Decision Factors in Selecting Health Insurance by Employer Size (2014) All 3-10 11-50 Employees 51+ Employers Employees Employees Employer Plan Selection Decision Factors, Name brand recognition 10.4% 11.8% 8.3% 8.0% Employer Plan Selection Decision Factors, Employee preference 9.9% 10.9% 9.4% 4.4% Employer Plan Selection Decision Factors, Broker referral 6.5% 5.5% 8.5% 7.4% Employer Plan Selection Decision Factors, Business Assoc referral 2.4% 2.7% 2.1% 0.8% Employer Plan Selection Decision Factors, Cost 35.3% 33.6% 39.4% 33.5% 29.3%*1 Employer Plan Selection Decision Factors, Flexibility to create options 17.5% 16.4% 16.1% *1 significantly different from both 3-10 and 11-50 employee groups Statistical significance at 95% level. Source: Massachusetts Employer Survey (MES)
Employee Utilization Information by Employer Size (2014) All 3-10 11-50 Employees 51+ Employers Employees Employees 39.3%*1 72.7%*2 Gets Employee Health Care Utilization Information from Broker 30.3% 19.4% 55.7%*2 Gets Employee Health Care Utilization Information from insurance company 33.0% 29.1% 35.5% *1 significantly different from 3-10 employee group *2 significantly different from both 3-10 and 11-50 employee groups Statistical significance at 95% level. Source: Massachusetts Employer Survey (MES)
Health Plan Changes (2011-2014) 2011 2014 Employer offers high deductible health plan 3-10 employees 11-50 employees 51+ employees All sized employers 30.8% 37.0% 36.3% 33.4% 39.2% 56.7%* 49.8% 45.3%* Employer offers self-funded health plan 3-10 employees 11-50 employees 51+ employees All sized employers 10.7% 9.8% 21.8% 11.5% 18.8% 15.0% 25.8% 18.5% Note: Employers may also offer options other than HDHPs. * -- difference between 2011 and 2014 is significant Statistical significance at 95% level. Source: Massachusetts Employer Survey (MES)
