2021 General Assembly Fiscal Analytics: Budget Considerations & Economic Outlook
Explore the budget considerations and economic forecasts for the 2021 General Assembly, highlighting improvements in economic indicators, revenue forecasts, and reasons for hope despite challenges. Learn about the impact of the pandemic on small businesses, consumer spending, savings rates, and the evolving business landscape towards teleworking. Stay informed about the changing fiscal landscape in Virginia and the U.S.

Uploaded on | 3 Views
Download Presentation

Please find below an Image/Link to download the presentation.
The content on the website is provided AS IS for your information and personal use only. It may not be sold, licensed, or shared on other websites without obtaining consent from the author. If you encounter any issues during the download, it is possible that the publisher has removed the file from their server.
You are allowed to download the files provided on this website for personal or commercial use, subject to the condition that they are used lawfully. All files are the property of their respective owners.
The content on the website is provided AS IS for your information and personal use only. It may not be sold, licensed, or shared on other websites without obtaining consent from the author.
E N D
Presentation Transcript
Budget Considerations and Issues for the 2021 General Assembly Fiscal Analytics, LTD James J. Regimbal Jr. January 11, 2021
The Economic and Revenue Forecast Has Improved Since the Special Session Forecast 2 Despite a nasty economic reversal from last year, the U.S. and Virginia are recovering. Economic indicators have markedly improved since the 1st Q bottom. VA initial unemployment claims continued to decline from 50,000 in May to 11,890 the week of Dec. 26. VA continuing unemployment claims have dropped from 400,000 in May to 63,443 for the week of Dec. 26 (vs. 19,097 one year ago). However, Virginia payroll employment in November was still 6% below last year about half the lowest level in the spring and a labor force participation rate of 63.7% - the lowest since this data was tracked in 1976. VA unemployment was 4.6% in November versus 2.5% last year (6.4% in U.S.). GF revenues are holding up better than most states due to Virginia s stable economic mix of industries and tax profile. Expectations for personal income and wages and salary growth have improved since the Special Session forecast. The August 2020-22 GF forecast reduction of $2,806.5 million was upgraded by $1,257.4 million in December. Expect the sales tax forecast in particular to be upgraded again. The August state transportation revenue 2020-22 forecast reduction of $750 million was upgraded by $170 mil. in December due to better retail sales, auto sales, and motor fuel taxes than previously assumed. 2
There Is Reason for Hope in 2021 3 Yes, small businesses are still closing across the country, the virus is again surging, more than 10 million Americans are either jobless or working fewer hours than before and a wide disparity exists between the home-owning majority and millions struggling to survive and who continue to need a bridge to when we can post-vaccine fully reopen our economy. But most American consumers are generallydoing better than expected thanks to stimulus payments, enhanced unemployment benefits, forgivable loans to small business, lower interest rates, and forebearance programs. Average personal incomes are significantly higher than before the pandemic due in part to a restructuring of the workplace for high-skill employees (i.e., working from home). However, normal consumer spending particularly on services - has been depressed by the virus resulting in about $1.5 trillion in extra savings since February - or 10% of normal spending, and savings rates are currently 12%. Alternatively, the 25% increase in money supply has caused asset prices to surge and consumers have improved balance sheets - having paid down $150 billion in revolving debt, added $2 trillion in bank and money market deposits and accumulated $300 billion in lasting durable goods. Home equity has increased by $1 trillion and stock market holdings have surged in value. Total U.S. household net worth is up $5 trillion. The overall business sector is also in solid shape with the nonfinancial corporate ratio of liquid assets to debt at its highest level since 1955. Even noncorporate businesses overall financial position has stayed about the same in the face of the tremendous Covid challenges. The 500,000 new business applications with the IRS this year are 6% above recent averages portending solid new business creation.
Hopefully Creative Destruction Will Occur 4 The longer the pandemic continues, the more entrenched teleworking/home-based businesses becomes, and the less entrenched commuting and business travel becomes. This will have long-term impacts on public transportation, airlines and commercial real estate, particularly retail and office space. Residential housing prices may continue to surge. Virtual education is obviously accelerating rapidly, but with consequences. Working parents (esp. females) are impacted, due to greater childcare responsibilities. One potential future - some parents may continue to use alternative methods of teaching children after the pandemic is over. The Virginia Department of Education currently does not forecast a rebound in public school student counts in FY 2022. On a more positive note, more innovation and entrepreneurship occurs during recessions when problems are highest. Government data shows, Americans are starting new businesses at the fastest rate in more than a decade (Sept. WSJ). Also, the pandemic has propelled collaboration in service of society. Companies with extensive libraries of drugs are rapidly innovating, scientists who haven t historically worked together are collaborating on research efforts, and thought leaders are sharing ideas across fields. 4
GF Revenue Forecast Significantly Improved From Special Session Introduced FY 2021 General Fund Revenue Forecast ($ Mil.) Special Session FY21 Special Session FY22 Intro FY21 Growth Intro FY22 Growth Intro FY21 Intro FY22 % GF FY 20 Actual $13,739.6 $14,245.9 Withholding 59.6% $13,378.1 $13,704.2 2.7% $14,341.0 3.7% $3,971.9 $3,985.4 Estimated Pay/Tax Dues 17.0% $3,804.5 $3,668.9 4.4% $3,784.9 0.3% ($2,198.8) ($2,130.0) Refunds -8.2% ($1,830.9) ($1,924.9) 20.1% ($2,062.4) -3.1% Net Individual Income 68.4% $15,351.6 $15,512.7 1.0% $16,101.3 3.8% $15,448.2 $16,063.5 Sales Taxes 16.5% $3,706.8 $3,609.4 -2.6% $3,705.7 2.7% $3,346.5 $3,438.7 Corporate Income 4.5% $1,011.7 $1,212.7 19.9% $1,289.6 6.3% $1,041.7 $1,143.0 Recordation 2.2% $483.5 $549.3 13.6% $467.0 -15.0% $422.4 $393.0 Insurance 1.6% $360.6 $333.9 -7.4% $360.8 8.1% $337.4 $359.5 All Other Revenues 3.7% $823.6 $790.6 -4.0% $805.0 1.8% $756.9 $787.8 Total Revenue 96.9% $21,737.8 $21,353.1 $22,008.6 1.2% $22,185.5 $22,729.4 3.3% ABC Profits 0.6% $137.5 $139.5 1.5% $132.7 -4.9% $139.5 $132.7 Sales Tax (.375%) 1.8% $406.0 $394.4 -2.9% $405.1 2.7% $365.7 $375.9 Other Transfers 0.7% $160.4 $105.4 -34.3% $103.7 -1.6% $105.2 $103.8 Total Transfers 3.1% $703.9 $639.3 -9.2% $641.5 0.3% $610.4 $612.4 Total GF Revenues 100.0% $22,441.7 $21,963.5 $22,647.9 0.9% $22,797.9 $23,370.9 3.2% Change from Special Session Foreacst $684.4 $573.0 5
Will GF Revenues Continue Stronger Growth? Expect the Sales Tax Forecast to be Upgraded Significantly 6 FY 2021 YTD Actual Introduced Revenue Est. Dec-June Req'd to Meet Estimate Last Year Dec-Jun Withholding 1.1% 2.9% 3.7% 1.7% Estimated Pay/Tax Dues 38.4% 4.4% -5.6% -9.8% Refunds 45.1% 20.1% 15.3% 4.1% Net Individual Income 4.4% 1.0% -1.0% -2.5% Sales Taxes 7.0% -2.6% -8.5% 0.5% Corporate Income 29.7% 19.9% 157.0% 0.3% Recordation 35.3% 13.6% -2.5% 22.0% Insurance n/a -7.4% -7.4% -5.6% All Other Revenues -9.1% -4.0% -1.0% -0.3% Total Revenue Growth Over Prior Year 6.1% 1.2% -1.6% -1.5% Source: Secretary of Finance presentation to Money Committees, Dec. 16, 2020
Almost All Virginia Income Tax Liability Is From Taxpayers Over $50,000 in Income 7 % of Tax Returns % of Total Tax Liability Under $25,000 30.5% 1.4% $25,000-50,000 21.5% 7.2% $50,000-150,000 35.2% 36.8% $150,000-500,000 11.7% 36.7% Over $500,000 1.0% 17.9% Totals 100.0% 100.0% Source: Dept. of Taxation/Chainbridge Software analysis of TCJA impact 7
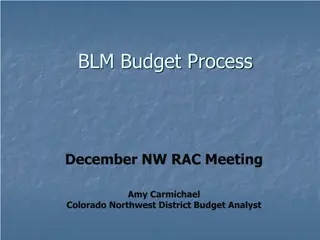
On-Line Sales Have Soared Along With Sales Tax Credited to Place of Residence 8 Virginia Sales Tax by Type 50.0% 44.3% 40.0% 30.0% 22.8% Brick and Mortar Online Total 20.0% 8.2% 10.0% 6.4% 1.2% 0.0% October YTD -2.0% -10.0% Source: Dept. of Taxation
GF Appropriations Growth From FY 2014-20 FY 2014 $103.2 $425.2 $654.1 $608.5 $171.8 $339.6 $950.0 $183.3 $144.0 $5,292.7 $1,782.1 $3,519.8 $1,541.5 $1,699.0 $42.0 $247.2 $0.0 $1.2 $17,705.2 FY 2020 $134.3 $507.3 $740.0 $776.4 $182.0 $360.5 $950.0 $302.3 $256.4 $6,581.4 $2,274.0 $4,988.7 $2,085.2 $2,072.3 $41.0 $273.5 $222.8 $3.2 $22,751.3 $ Change $31.1 $82.1 $85.9 $167.9 $10.2 $20.9 % Change 30.1% 19.3% 13.1% 27.6% Legislative and Executive Judicial Dept. Administration/Comp Board Treasury Board Debt Service Other Finance Rainy Day Fund Deposit Car Tax Reimbursement Commerce and Trade Agriculture / Nat. Resources K-12 Education/DOE Higher & Other Education DMAS Medicaid Other Health & Human Services Public Safety & Veterans/HS Transportation Central Appropriations Cash Reserve Independent Agencies/Capital Total GF Appropriations 5.9% 6.2% 0.0% 64.9% 78.1% 24.3% 27.6% 41.7% 35.3% 22.0% -2.4% 10.6% NM 166.7% 28.5% $0.0 $119.0 $112.4 $1,288.8 $491.9 $1,468.9 $543.7 $373.3 -$1.0 $26.3 $222.8 $2.0 $5,046.1 9 9 9
Key Budget Changes from the Special Session Additional GF biennial savings of about $280 million, primarily from reductions in Medicaid, FAMIS, and Children s Health Insurance and state matching rates, state health insurance premium holiday and reduced rates, and increased ABC profits. Increased GF spending of about $470 million, including numerous health, human and mental health service initiatives, criminal justice reform related spending including $7 mil. for local police departments and a $500 bonus for other law enforcement personnel, fully restored the K12 at-risk add-on increase andpartially restored Virginia Preschool Initiative funding in the second year. Left an unappropriated balance of $302.2 mil., which relied on previous year carryforwards and had a structural imbalance in spending above FY 2022 revenues. Authorized $97.8 mil from the GF for a bonus for state employees and state-supported local employees contingent on available final FY 2021 revenues. Also directed the Governor to include a salary increase in his December introduced budget for K-12 instructional and support positions during the second year if sufficient revenue is projected. Provided $95.2 million the first year from the COVID-19 Relief Fund (gray machine revenue), distributed to school divisions based on the net reduction of state funds in the introduced budget, and counted as local match payments for the SOQ. Left $1.1 billion in reserves. 10 10 10
2021 Session Introduced GF Budget ($ Mil.) Introduced FY 2021 $148.8 $524.6 $792.3 $811.6 $267.2 $77.4 $89.0 $950.0 $397.5 $264.9 $6,970.8 $2,410.8 $4,495.8 $2,276.0 $2,273.1 Annual Introduced Change $13.9 $12.8 $52.2 $46.7 $85.1 ($185.5) $89.0 $0.0 $88.1 $8.2 $349.4 $136.8 ($231.2) $198.1 $188.3 ($41.0) ($347.1) Annual Change $1.8 $15.8 ($8.7) $51.6 ($99.8) ($77.4) $561.0 $0.0 $17.0 ($6.1) $226.4 $34.1 $895.2 $177.9 $17.8 $55.0 $209.4 Change Above FY20 Base FY 2020 FY 2022 $150.6 $540.4 $783.6 $863.2 $167.4 $0.0 $650.0 $950.0 $414.5 $258.8 $7,197.2 $2,444.9 $5,391.0 $2,453.9 $2,290.9 $55.0 $206.5 $ Change $29.6 $41.4 $95.7 $145.0 $70.4 ($448.4) $739.0 $0.0 $193.2 $10.3 $925.2 $307.7 $432.8 $574.1 $394.4 ($27.0) ($484.8) % Change 11.0% Legislative and Executive Judicial Dept. Administration/Comp Board Treasury Board Debt Service Other Finance Rainy Day Fund Deposit Cash Reserve Car Tax Reimbursement Commerce and Trade Agriculture / Nat. Resources K-12 Education/DOE Higher & Other Education DMAS Medicaid Other Health & Human Services Public Safety & Veterans/HS Transportation Central Appropriations $134.9 4.0% 6.5% 9.5% 19.3% -85.3% $511.8 $740.1 $764.9 $182.1 $262.9 n/a $0.0 0.0% 31.2% 2.0% 7.0% 6.8% 4.6% 13.8% 9.5% -32.9% -70.4% $950.0 $309.4 $256.7 $6,621.4 $2,274.0 $4,727.0 $2,077.9 $2,084.8 $0.0 ($2.9) $41.0 $344.2 Independent Agencies/Capital $2.1 ($1.2) $20.1 $18.0 $15.6 236.4% $3.3 $22,286.4 Total GF Appropriations $22,749.0 $462.6 $24,838.0 $2,089.0 $3,014.2 6.8% 11
New K-12 GF Spending in the Introduced Budget 12 No loss funding to offset projected ADM losses for the biennium. ADM forecast for FY 22 assumes no rebound from pandemic losses. On a statewide basis, the revised ADM projections are 44,096 students lower in FY 2021 and 44,296 students lower in FY 2022 than the original projections. Without no loss funding, the ADM updates would have resulted in an estimated decrease in Direct Aid payments on a statewide basis of $201.2 million in FY 2021 and $202.9 million in FY 2022 $80 mil. for a 2 percent bonus for SOQ instructional and support positions $61.3 mil. VRS teacher retirement plan deposit to help address unfunded liabilities. $27 mil. for school counselors pursuant to the Standards of Quality. This action reduces the staffing ratios to 325-to-1 in all schools in FY 2022. $11.1 for additional 10% boost in VPI per pupil funding to $7,655, plus $5 mil. to restore unallotted Early Childhood Initiative funding. ESL program testing suspended, resulting in presumptive ESL funding that restores $4.3 mil. of $11.8 mil. reduction in FY 2021 and $6.5 mil. of $19 mil. reduction in FY 2022. $95 mil. Grey Machine revenue returned to Governor s Covid 19 Relief Fund . Additional sales tax and $52.9 mil. GF to replace Grey Machine funding. 12
Other New GF Spending in the Introduced Budget (Left a $1.9 B Reserve and $51 M Unappropriated Balance) 13 $650 million deposit to cash reserve fund in FY 22. $98 mil. for state and state-supported local employee bonus $89 mil. for mass vaccination efforts $79 mil. for Emergency Management COVID-19 disaster response funding $50 mil. to expand Amtrak service to Christiansburg $41 mil. for increased funding for the Virginia Housing Trust Fund $39 mil. for state employee health insurance plan deposits to help address unfunded liabilities $36 mil. for VCCS funding to implement the Get Skilled, Get a Job, Give Back Program $30 mil. to restore undergraduate student financial assistance $25 mil. for criminal record expungement including marijuana and related legislation $15 mil. in additional funding for broadband deployment 13
Unaddressed Local Government Needs 14 Provide more funding for an adequate public health care system to distribute vaccines and better testing/contact tracing Change bonuses to salary increases for teachers/staff, and state supported local employees Restore unallotted Aid to Local Police (HB 599) funding and continue conforming to the Code. Jail per diem needs that have not increased in ten-years Adequately fund efforts to reform Virginia s mental health system Provide assistance for greater economic development in stressed localities. Additional state assistance for elections to instill greater confidence in election process and reduce local fiscal stress Reduce disparity in pay for public defender salaries to Commonwealth Attorneys Respond to stormwater local assistance needs Additional funds to reduce VRS teacher pension unfunded liabilities Relieve Line of Duty Act (LODA) pressures from worker compensation issues (incl. COVID) Potential CSA needs to implement JLARC study recommendations (See Appendix for details) 14
DPB Survey of $1.3 Billion Local Cares Act Spending 15 15 15
New CRRSA Act Helps VA Schools With $1 Billion in Additional Aid Total U.S. Aid New Federal COVID Relief by Category Amount ($ Bil.) Unofficial VA Amount ($ Mil.) 16 Aid to Small Business $325 PPP Second Draw $284 Extend Unemployment Benefits for 11 weeks ($300) $120 $1,091 Stimulus Checks of $600 per person $166 $3,873 Education $82 Must award by 1/2022 K-12 grants (allocated based on Title 1 Part A) $54 $939 and obligate by 9/2023 Higher Ed $23 $488 Governor's Ed Fund (GEAR) $4 $76 Health Care $63 Testing, Tracing, and Covid Mitigation $22 $519 Vaccine Distribution $5 $102 Transportation (transit, highways airports) $45 Highways $10 $253 Nutrition & Ag $26 Rental/Utility Assistance $25 $568 9/30/21 deadline Community Lenders $12 Child Care grants $10 $202 Broadband grants (half for direct assistance) $7 Tax Cuts $30 Total New Relief Authorization $910 16
CRRSA - K12 Allowable Uses 17 Providing principals and others school leaders with the resources necessary to address the needs of their individual schools. Activities to address the unique needs of low-income children or students, children with disabilities, English learners, racial and ethnic minorities, students experiencing homelessness, and foster care youth. Developing and implementing procedures and systems to improve the preparedness and response efforts of local educational agencies. Training and professional development for staff of the local educational agency on sanitation and minimizing the spread of infectious diseases. Purchasing supplies to sanitize and clean the facilities of a local educational agency, including buildings operated by such agency. Planning for, coordinating, and implementing activities during long-term closures, including providing meals to eligible students, providing technology for online learning to all students. Purchasing educational technology (including hardware, software, and connectivity) for students who are served by the local educational agency that aids in regular and substantive educational interaction between students and their classroom instructors, including low-income students and children with disabilities, which may include assistive technology or adaptive equipment Providing mental health services and supports. Planning and implementing activities related to summer learning and supplemental after school programs, including providing classroom instruction or online learning during the summer months. Addressing learning loss among students, including low-income students, children with disabilities, English learners School facility repairs and improvements to enable operation of schools to reduce risk of virus transmission and exposure to environmental health hazards, and to support student health needs. Inspection, testing, maintenance, repair, replacement, and upgrade projects to improve the indoor air quality in school facilities, including mechanical and non-mechanical heating, ventilation, and air conditioning systems, filtering, purification and other air cleaning, fans, control systems, and window and door repair and replacement. 17
Wild Cards Will Continue to Drive Budget Uncertainty 18 It will be May/June tax filing before the full extent of the impact on state revenues is known. Full economic recovery depends on the end of the pandemic. YTD indicates higher sales tax than the introduced budget forecast (XMAS season is the wildcard) further improving K-12 distributions, transportation, and local budgets. Virginia will also need to consider tax de-conformity from Cares Act business tax reductions. o o Significant additional federal help for COVID-19 testing/vaccines, PPE, childcare, housing, broadband, rental assistance, and an additional $1 bil. in K-12 funds. Does this offset need for some introduced general funds? Expect Medicaid budget pressures to resume in the 2022-24 biennium. Six percent growth would require $1.1 bil. GF FY 2022 introduced budget has ongoing spending $366 mil. more than current estimated ongoing revenues. This could produce continued conservative budgets in the future. Does state de-conform from federal tax changes in CRRSA that would cost over $600 million? Potential new federal tax changes from new Congress that impact Virginia revenues? 18
Source: https://www.doe.virginia.gov/school_finance/budget/calc_tools/index.shtml 19
March 2021 ADM Expected to Decline by 3% SOQ Is Funded on a Per Pupil Basis (Hold Harmless Proposed in Introduced Budget) March 31 ADM Count 20 Statewide 1,195,844 1,204,422 1,209,568 1,215,363 1,222,545 1,229,317 1,258,833 1,240,093 1,243,921 1,246,931 1,245,029 1,250,770 1,213,093 1,218,331 % Increase 2009 2010 2011 2012 2013 2014 2015 2016 2017 2018 2019 2020 2021* 2022* 0.7% 0.4% 0.5% 0.6% 0.6% 2.4% -1.5% 0.3% 0.2% -0.2% 0.5% -3.0% 0.4% * DOE projected in introduced budget 20 20
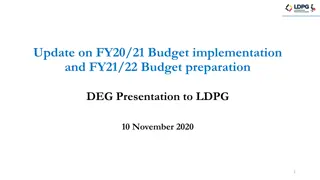
Virginia Instructional Pay Increases Have Slowed Considerably Since 2009 Average Salary - All Instructional Positions * $70,000 $61,611 $58,677 $60,000 $53,581 $50,000 $42,788 $40,000 $30,000 $20,000 $10,000 $0 2002 2009 2018 2020 est. Source: Superintendent s Annual Report. *All instructional positions include classroom teachers, guidance counselors, librarians, principals, and assistant principals. 21
State-Funding for Teacher Salary Increases Lags Inflation (2% Salary Increases in FY 21 and FY 22 Unallotted) State Salary Increase Compound Growth 22 State-Funded Salary % Increase Compound CPI Growth Fiscal Year 2009 2010 2011 2012 2013 2014 2015 2016 2017 2018 2019 2020 2021 2022 0.0% 2.0% 0.0% 0.0% 0.0% 2.0% 0.0% 1.5% 0.0% 2.0% 0.0% 5.0% 0.0% 0.0% 0.0% 2.0% 2.0% 2.0% 2.0% 4.0% 4.0% 5.6% 5.6% 7.7% 7.7% 13.1% 13.1% 13.1% 1.4% 2.4% 4.5% 7.5% 9.3% 11.1% 11.8% 12.6% 14.8% 17.3% 19.8% 22.4% 24.6% 27.3% Note: Introduced budget includes a 2% bonus for FY 2022 22 22
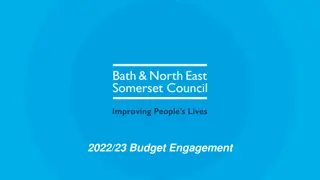
Local K-12 Operations Funding Grew Much Faster Than State Operations Funding from FY 2009-19 Per Pupil K-12 Funding $14,000 $901 $12,000 $729 $10,000 $5,388 6% growth $5,082 $8,000 $6,000 $4,000 $6,642 21% growth $5,504 $2,000 $0 2009 2019 Local State Federal Source: DOE Superintendents Annual Reports http://www.doe.virginia.gov/statistics_reports/supts_annual_report/index.shtml 23 23
What does the Future Hold for Local Budgets Hit by the Covid Shutdowns? 24 A greater revenue reliance on restaurants, entertainment venues, hotels, and other commercial real estate hit harder by mandated business closures or restrictions. Fortunately, residential real estate values are holding up well portending stable or rising assessments. Unknown how commercial real estate assessments will change over time. Sales tax revenue impacts will vary significantly by locality due to changes in consumption patterns particularly online vs. brick and mortar. Online sales are recorded where the sale was initiated generally helping rural localities most. Could have a major impact on future local investments in economic and commercial development. Local governments usually respond to revenue declines by improving operational efficiencies, cutting social services and canceling or postponing capital projects. Austerity measures often involve payroll reductions through hiring freezes, furloughs, and layoffs. Evidence from the previous recession also suggests that overall education funding will decline sharply due to COVID-19 recession. Based on the experiences of the 2009 recession and its aftermath, the impact of economic downturns on school budgets may be long-lasting. Spending per student in elementary and secondary schools started to decline in 2009 and did not fully recover to pre-recession nominal levels until 2017. 24
A Look at Local Revenue Reliance 25 Reliance on Local Source Tax Revenue Cities Counties Large Towns Real Property Personal Property Local Sales Tax BPOL Transient Occupancy Meals All Other 45.1% 8.8% 6.6% 4.9% 1.8% 6.1% 26.6% 54.8% 12.4% 5.5% 2.9% 0.8% 1.0% 22.7% 23.3% 3.6% 7.4% 9.5% 4.5% 18.8% 32.8% 25 25
Localities Took 3-4 Years To Exceed Lost Local Revenue After Last Recession 26 Revenue Growth Comparison ($ Mil.) County Local Revenue Cities Local Revenue % Growth Fiscal Year State GF % Growth % Growth 2009 $14,315.1 $11,269.9 $5,541.6 2010 $14,219.5 -0.7% $10,962.5 -2.7% $5,377.8 -3.0% $15,040.2 2011 5.8% $11,152.6 1.7% $5,393.9 0.3% $11,450.7 2012 $15,846.7 5.4% 2.7% $5,497.0 1.9% $5,601.9 2013 $16,684.6 5.3% $11,846.8 3.5% 1.9% 2014 $16,411.4 -1.6% $12,255.5 3.4% $5,781.4 3.2% 2015 $17,735.6 8.1% $12,815.1 4.6% $5,956.6 3.0% 2016 $18,040.1 1.7% $13,273.6 3.6% $6,163.8 3.5% 2017 $18,695.1 3.6% $13,959.8 5.2% $6,373.1 3.4% 2018 $19,880.8 6.3% $14,452.6 3.5% $6,638.7 4.2% 2019 $21,307.5 7.2% $15,266.7 5.6% $6,877.8 3.6% 2020 $21,737.8 2.0% N/A N/A N/A N/A 26
State Income Tax Growth Has Significantly Exceeded Local Real Estate Tax Growth Since 2009 Recession $16,000,000,000 $15,000,000,000 $14,000,000,000 $13,000,000,000 $12,000,000,000 $11,000,000,000 $10,000,000,000 $9,000,000,000 $8,000,000,000 2009 2010 2011 2012 2013 2014 2015 2016 2017 2018 2019 State Individual Income Tax Local Real Estate Tax 27 27 27
Appendix: JLARC Study of Children's Services Act & Private Special Education Day School Costs 28 CSA spending for private special education day school services has more than doubled since FY10, growing by approximately 14 percent per year from $81 million to $186 million, accounting for 44 percent of all CSA spending in 2019. Half of the growth in private day school spending is explained by a 50 percent increase in enrollment over the last 10 years because of three factors: more new children placed in private day schools each year, children being placed in private day schools at younger ages, and children spending more time in private day schools. Tuition rates increased by 25 percent between FY10 and FY19, similar to inflation during that time. However, tuition rates can vary substantially which has led to questions about reasonableness and profits. However, JLARC found private day schools charge tuition rates consistent with the cost of providing low student-to-staff ratios in small environments, and a majority of schools do not earn excessive profits. JLARC proposes that state law be changed and CSA funds be used for children in public school settings and believes VDOE would be a more logical administrator of private special education day school funding. 28
Appendix: JLARC Study of Children's Services Act & Private Special Education Day School Costs 29 CSA mandates state and local CSA programs (with sum-sufficient funds ) serve children in or at risk of being placed in foster care and children with disabilities who require placements in private day schools. JLARC believes serving non-mandated children with less severe emotional and behavioral issues could be an effective and ultimately less costly child risk prevention strategy and reduce geographical disparities in service availability. JLARC believes private day school performance expectations should be comparable to those for public schools. Stakeholders and parents of private day school students do not have information on the same basic metrics for private day schools that are reported for every public school in the Commonwealth. JLARC proposed requiring local programs to measure, collect, and report data on timeliness in service provision and target assistance to those programs that struggle the most with it. JLARC proposes giving OCS more clear authority to intervene when a local CSA program is ineffectiveanddirecting OCS to more actively monitor and work with local CSA programs that need technical assistance or are underperforming. 29


")