Explore the 2023-2024 Dual Enrollment Report from the Office of the Commissioner of Higher Education, detailing enrollment growth trends, participation rates, and comparative statistics. Gain insights into public student participation, district rates, MHSA class involvement, modality, credit types, and course pass rates across various educational settings.
Please find below an Image/Link to download the presentation.
The content on the website is provided AS IS for your information and personal use only. It may not be sold, licensed, or shared on other websites without obtaining consent from the author. If you encounter any issues during the download, it is possible that the publisher has removed the file from their server.
You are allowed to download the files provided on this website for personal or commercial use, subject to the condition that they are used lawfully. All files are the property of their respective owners.
The content on the website is provided AS IS for your information and personal use only. It may not be sold, licensed, or shared on other websites without obtaining consent from the author.
23-24 DE District Participation Rates & Counts Participation Rates = DE Students in district / Total Juniors & Seniors in district Number displayed = DE Students in District .34 Only Public HS Students
Public HS Participating in DE by MHSA Class MHSA MHSA Class Class AA AA A A B B C C Total Total HS with at least 1 DE HS with at least 1 DE Student in 2023 Student in 2023- -24 16 16 22 22 39 39 76 76 153 153 Total MHSA High Total MHSA High Schools in 2023 Schools in 2023- -24 16 16 22 22 43 43 91 91 172 172 24 24 US Avg 89% US Avg 89% 88.9% 88.9% 23-24 MHSA classes applied to all years
2023-24 DE Course Modality & Credit Type by HS Type Pass Rates = Credit Hours Earned / Credit Hours Taken Modality & Credit Type Modality & Credit Type AA AA A A B B C C Home School Home School Private Private In In- -Person Concurrent Person Concurrent In In- -Person Early College Person Early College Online Early College Online Early College 84.4% 84.4% 63.2% 63.2% 70.9% 70.9% 70.4% 70.4% 80.7% 80.7% 63.3% 63.3% 82.0% 82.0% 38.9% 38.9% 78.6% 78.6% 91.2% 91.2% 96.9% 96.9% 88.2% 88.2% 72.7% 72.7% 42.2% 42.2% 66.7% 66.7% 95.0% 95.0% 52.7% 52.7% 76.8% 76.8%
Matriculated DE Students by Year * Only * Only MUS MUS data data Questions Questions Color Color Did the student ever enroll in the MUS? Did the student ever enroll in the MUS? If not, did the student ever enroll outside of the MUS? If not, did the student ever enroll outside of the MUS? If not, was the student employed in Montana 2 years after participation in DE? If not, was the student employed in Montana 2 years after participation in DE? If none of the above, student categorized as other If none of the above, student categorized as other
Matriculated DE Students by State Top Majors Top Majors Undeclared Biology Nursing Psychology Business Exercise Science Elementary Education Alaska- 6 Hawaii- 10 10 Students 40 Students 6.5% of all DE students matriculated outside of the MUS Top 20 Institutions Indicated by Name Top 20 Institutions Indicated by Name Top 60 Institutions Indicated by Top 60 Institutions Indicated by
Comparative Statistics Metrics Metrics DE Students in MUS DE Students in MUS MUS (excludes DE) MUS (excludes DE) Fall 2022 to Fall 2023 Retention Fall 2022 to Fall 2023 Retention (First (First- -Time Freshman 2022 Cohort) Time Freshman 2022 Cohort) 2 Year Associates Grad Rates 2 Year Associates Grad Rates (2022 Cohort) (2022 Cohort) 80.4% 80.4% 63.9% 63.9% 23.9% 23.9% 20.2% 20.2% 4 Year Associates Grad Rates 4 Year Associates Grad Rates (2020 Cohort) (2020 Cohort) 37.8% 37.8% 28.9% 28.9% 4 Year Bachelors Grad Rates 4 Year Bachelors Grad Rates (2020 Cohort) (2020 Cohort) 40.5% 40.5% 35.6% 35.6% 8 Year Bachelors Grad Rates 8 Year Bachelors Grad Rates (2016 Cohort) (2016 Cohort) 61.3% 61.3% 50.8% 50.8% Upon graduation, DE students average $570 less in student loans per DE credit than non-DE graduates
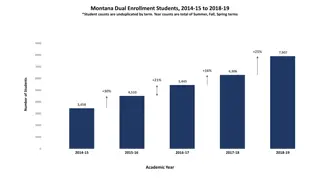
Key Takeaways DE & CTE DE counts and public school participation rates continue to DE & CTE DE counts and public school participation rates continue to increase increase In In- -person concurrent enrollment is the primary credit type for DE person concurrent enrollment is the primary credit type for DE Online early college is more common in Class B & C schools Online early college is more common in Class B & C schools 53 53- -61% MUS matriculation rates for 2018 61% MUS matriculation rates for 2018- -2022 DE cohorts 2022 DE cohorts DE students have higher retention rates and graduation rates than DE students have higher retention rates and graduation rates than non non- -DE students DE students