2023 Mathematics Framework Webinar Highlights
Join the California Department of Education for insights on the big ideas of the 2023 Mathematics Framework. Explore overarching concepts, content standards, and teaching approaches. Discover valuable resources and upcoming webinars for a deeper understanding of mathematics education.
Download Presentation

Please find below an Image/Link to download the presentation.
The content on the website is provided AS IS for your information and personal use only. It may not be sold, licensed, or shared on other websites without obtaining consent from the author.If you encounter any issues during the download, it is possible that the publisher has removed the file from their server.
You are allowed to download the files provided on this website for personal or commercial use, subject to the condition that they are used lawfully. All files are the property of their respective owners.
The content on the website is provided AS IS for your information and personal use only. It may not be sold, licensed, or shared on other websites without obtaining consent from the author.
E N D
Presentation Transcript
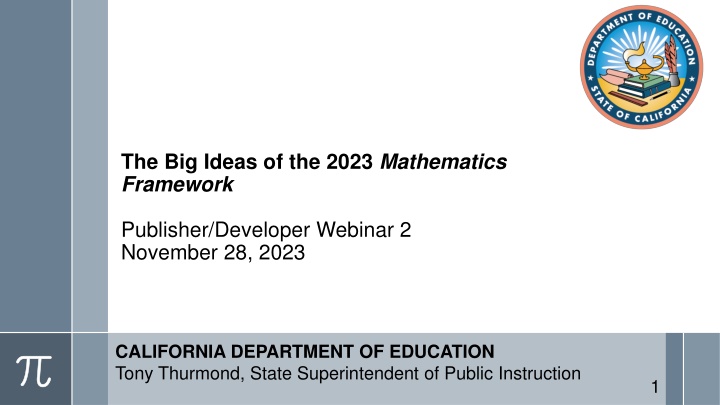
The Big Ideas of the 2023 Mathematics Framework Publisher/Developer Webinar 2 November 28, 2023 CALIFORNIA DEPARTMENT OF EDUCATION Tony Thurmond, State Superintendent of Public Instruction 1
Presenters Dr. Mike Torres, Director Curriculum Frameworks & Instructional Resources Division Dr. Marla Clayton Johnson, Education Administrator Instructional Materials and Access Unit Carrie Marovich, Education Programs Consultant Standards and Curricular Guidance Unit Johanna Harder, Education Programs Consultant Standards and Curricular Guidance Unit Emily Oliva, Education Programs Consultant Professional Learning Support and Monitoring Unit 2
Upcoming Webinar for Publishers/Developers December 19, 10:30 11:30 a.m. Instructional Materials to Support Systemic Improvement in Mathematics 3
Resources on CDE Website Mathematics Framework Summary Chapters and appendices Instructional Materials Evaluation Criteria (Ch 13) Frequently Asked Questions on the California Department of Education (CDE) website 2023 California Mathematics Framework 2025 Instructional Materials Adoption (forthcoming) 4
Purpose of Today's Webinar 1. Investigate the Big Ideas for Transitional Kindergarten through Grade Five 2. Investigate the Big Ideas for Grades Six through Eight 5
The Big Ideas Identify overarching mathematical concepts at each grade level Include clusters of content standards Connect mathematical concepts Intend to support multidimensional teaching and authentic problem solving 7
Grade 6 Big Ideas Link to long description 8
THE WHY, HOW, AND WHAT OF MATHEMATICS INSTRUCTION Link to long description 9
THE WHY, HOW, AND WHAT OF MATHEMATICS INSTRUCTION (2) Link to long description 10
Supporting Focus, Coherence, and Rigor Focus Depth of understanding Coherence Coherent big-picture view of mathematics Rigor Integration of conceptual understanding, problem solving and computation, and application 11
Five Components of Equitable and Engaging Teaching 12
The Big Ideas: Transitional Kindergarten through Grade Five 13
Grade 4 Big Ideas Link to long description 14
The Big Ideas in Grade Four Circles, Fractions and Decimals Connected Problem Solving Multi-digit Numbers Visual Fraction Models Number & Shape Patterns Fraction Flexibility Factors and Area Models Shapes and Symmetries Rectangle Investigations Measuring and Plotting 15
Big Idea: Multi-digit Numbers 4.NBT.1: Recognize that in a multi-digit whole number, a digit in one place represents ten times what it represents in the place to its right. 4.NBT.2: Read and write multi-digit whole numbers using base-ten numerals, number names, and expanded form. Compare two multi- digit numbers based on meanings of the digits in each place, using >, =, and < symbols to record the results of comparisons. 4.NBT.3: Use place value understanding to round multi-digit whole numbers to any place. 4.NBT.4: Fluently add and subtract multi-digit whole numbers using the standard algorithm. 4.OA.1: Interpret a multiplication equation as a comparison, e.g., interpret 35 = 5 7 as a statement that 35 is 5 times as many as 7 and 7 times as many as 5. Represent verbal statements of multiplicative comparisons as multiplication equations. 16
Example: Grade 4 Content Connections, Big Ideas, and Standards Content Connection Big Ideas: Grade 4 CCSS Grade 4 Standards OA.5, OA.1, OA.2 NBT.4 Exploring Changing Quantities Exploring Changing Quantities Exploring Changing Quantities Number and shape patterns Factors and area models OA.1, OA.2, OA.4 NBT.5, NBT.6 Multi-digit numbers NBT.1, NBT.2 NBT.3, NBT.4, OA.1 17
Comparing Numbers and Place Value Relationships: Overview To Make Sense of the World (Driver of Investigation [DI] 1), students will (Standards for Mathematical Practice [SMP]) make sense of problems and persevere in solving them; reason abstractly and quantitatively; construct viable arguments and critique the reasoning of others; and use appropriate tools strategically while Exploring Changing Quantities (Content Connection [CC] 2). Domain of Emphasis: Number and Operations in Base Ten 18
Sample Grade Four Lesson: Comparing Numbers and Place Value Relationships 19
Background & Lesson Context Over half the students are designated English learners. Mrs. Verners, the teacher, has ensured the discourse of compare and contrast in a mathematical context (i.e., more than, less than, equal to, greater than, how many more, how many times more) has been used in her previous lessons. The students have been working on daily lessons and routines with a focus on number and operations in base ten with an emphasis on place value. Mrs. Verners has created opportunities to develop background knowledge regarding the places described within the task. 20
Comparing Numbers and Place Value Relationships: Target and Task Learning Target: The students will organize fourth-grade population data for different locations across the United States in order to compare and describe the relationships between the values of digits within the number. Lesson Task: There are almost 400,000 fourth graders in Texas, 40,000 fourth graders in Mississippi, and about 4,000 fourth graders in Washington, DC. There are almost 4 million fourth graders in the United States. (We write 4 million as 4,000,000.) Use the approximate populations given to solve: How many times as many fourth graders are there in Texas as in Mississippi? How many times as many fourth graders are there in the United States as in Texas? How many times as many fourth graders are there in the United States as in Washington, DC? (Source: Adapted from Illustrative Mathematics, 2016a) 21
Follow-up Question Examples What do you notice about the numbers/populations listed in your table? What relationship do you notice between these numbers? What patterns do you notice in the place value of the digit 4? What tools might help you as you re trying to represent the place value of the 4 in each of these numbers? (e.g., base ten blocks, place value chart) How would you describe the relationship between the digit 4 in these numbers? You noticed that each place value is x 10 the place before it. How might you find the relationship between 4,000 and 4,000,000? 22
REVISITING THE WHY, HOW, AND WHAT OF MATHEMATICS INSTRUCTION Link to long description 23
Comparing Numbers and Place Value Relationships: SMPs/DIs/CCs Learning Target: Students will organize fourth-grade population data for different locations across the United States to compare and describe the relationships between the values of digits within the number. (SMPs) Lesson Task: Texas has almost 400,000 fourth graders; Mississippi has about 40,000; and Washington D.C. has about 4,000. There are almost 4 million fourth graders in the United States. (DIs) Use the approximate populations given to solve: (CCs) How many times as many fourth graders are there in Texas as in Mississippi? How many times as many fourth graders are there in the United States as in Texas? How many times as many fourth graders are there in the United States as in Washington, DC? 24
The Big Ideas: Grades Six through Eight 25
Grade 7 Big Ideas Link to long description 26
The Big Ideas in Grade Seven Populations and Samples Probability Models Visualize Populations Scale Drawings 2-D and 3-D Connections Proportional Relationships Angle Relationships Shapes in the World Unit Rates in the World Graphing Relationships 27
Big Idea: Populations and Samples 7.SP.1: Understand that statistics can be used to gain information about a population by examining a sample of the population. [. . .] Understand that random sampling tends to produce representative sample and support valid inferences. 7.SP.2: Use data from a random sample to draw inferences about a population with an unknown characteristics of interest. Generate multiple samples of the same size to gauge the variation in estimates. 7.RP: Analyze proportional relationships and use them to solve real-world and mathematical problems. (7.RP.1, 7.RP.2, 7.RP.3) 7.NS: Apply and extend previous understandings of operations with fractions to add, subtract, multiple, and divide rational numbers. (7.NS.1, 7.NS.2, 7NS.3) 7.EE.3: Solve multi-step real-life and mathematical problems posed with positive and negative rational numbers in any form, using tools strategically. Apply properties of operations to calculate with numbers in any form [ ] 28
Example: Grade 7 Content Connections, Big Ideas, and Standards Content Connection Big Ideas: Grade 7 CCSS Grade 7 Standards SP.1, SP.2 RP.1, RP.2, RP.3 NS.1, NS.2, NS.3 EE.3 SP.3 SP.4, NS.1, NS.2, NS.3 EE.3 SP.5, SP.6, SP.7, SP.8 SP.1, RP.2, RP.3 NS.1, NS.2, NS.3 EE.3 Reasoning with Data Populations and Samples Reasoning with Data Visualize Populations Reasoning with Data Probability Models 29
Sample Grade 7 Lesson: Crows, Seagulls, and School Lunches 30
Comparing Numbers and Place Value Relationships: Overview (2) In order to Predict What Could Happen and Impact the Future (DI), students will (SMP) model with Mathematics; use appropriate tools strategically; and attend to precision while Exploring Changing Quantities (CC 2). Domain of Emphasis: Statistics & Probability 31
Background & Lesson Context (2) The teacher asks students to generate authentic questions to conduct an investigation. The teacher wants to align California s Environmental Principles and Concepts (EP&C II, EP&C 4, EP&C 5), Next Generation Science Standards (SEP-3, SEP-4, SEP-5, SEP-6, LS2.B, ETS1.B) and mathematics standards. The teacher has carefully crafted a way for students to ask authentic questions that can then be steered toward the Big Idea of Populations and Samples. 32
Crows, Seagulls, and School Lunches: Target and Task Learning Target: Students will use random sampling to draw inference about a population (7.SP.1, 7.SP.2). Students will draw informal comparative inferences about two populations (7.SP.3, 7.SP.4). Lesson Task: Students explore their campus and make observations. (DI) The teacher provides opportunities to generate authentic questions about observations in lunch area. Students ask: When are the largest numbers of birds in the lunch area? What is attracting the birds? Do students at different grades produce different amounts of food waste and trash? (CC) (Source: Adapted from Illustrative Mathematics, 2016a) 33
Crows, Seagulls, and School Lunches: DIs/SMPs/CCs Explore: In small groups students generate specific questions to investigate. (DI) The class settles on three questions: (1) Do students in different grade produce the same amounts and types of food waste and trash? (2) Do students in different grades deal with food waste and trash in the same way? (3) Are there different numbers of birds in the lunch area when different grade-level students are eating? (SMP) Teacher introduces random sampling. Together the class creates a plan to collect and analyze data. The class makes inferences based on data. (CC) 34
Crows, Seagulls, and School Lunches: Explore Lesson Task/Explore: In small groups students generate specific questions to investigate. (DI) The class settles on three questions: (1) Do students in different grade produce the same amounts and types of food waste and trash? (2) Do students in different grades deal with food waste and trash in the same way? (3) Are there different numbers of birds in the lunch area when different grade-level students are eating? Teacher introduces random sampling. Together the class creates a plan to collect and analyze data. The class makes inferences based on data. 35
Crows, Seagulls, and School Lunches: Beyond Beyond: Students ask more questions (e.g., how the food waste and trash might be affecting those who live near the school). (DI) Students have opportunities to research and engineer solutions (NGSS) and present their statistical work and design solutions to authentic audiences. Mathematical Big Ideas: Throughout the investigation students were thinking about Populations and Samples (the quantities that describe them), while also working with ratios and fractions. 36
Key Takeaways for Materials Development Design lessons and units that bring together Big Ideas, Drivers of Investigation, Content Connections, and SMPs. Encourage the development of a coherent, big picture view of mathematics through explicit connections of Big Ideas within and across grade levels. Scaffold use of mathematical language, particularly how concepts and the language used to talk about them are connected across grade levels. Provide opportunities for integrated learning of concepts, problem solving strategies and computational skills, and application. 37
https://www.cde.ca.gov/ci/ma/cf/ 2023 California Mathematics Framework: https://www.cde.ca.gov/ci/ma/cf/ RESOURCES https://www.cde.ca.gov/ci/ma/im/ 2025 California Mathematics Adoption: https://www.cde.ca.gov/ci/ma/im/ Questions? David Almquist, Publisher Liaison dalmquis@cde.ca.gov Instructional Materials and Access Unit dalmquis@cde.ca.gov 38
Thank you for attending. Please see your email to register for our upcoming Mathematics Adoption webinar: December 19: Instructional Materials to Support Systemic Improvement in Mathematics 39
Long Description for Slide 8 (1) The graphic illustrates the connections and relationships of some sixth- grade mathematics concepts. Direct connections include the following: Variability in Data directly connects to: The Shape of Distributions, Relationships Between Variables The Shape of Distributions directly connects to: Relationships Between Variables, Variability in Data Fraction Relationships directly connects to: Patterns Inside Numbers, Generalizing with Multiple Representations, Model the World, Relationships Between Variables Patterns Inside Numbers directly connects to: Fraction Relationships, Generalizing with Multiple Representations, Model the World, Relationships Between Variables (Continues on next slide) 40
Long Description for Slide 8 (2) Generalizing with Multiple Representations directly connects to: Patterns Inside Numbers, Fraction Relationships, Model the World, Relationships Between Variables, Nets & Surface Area, Graphing Shapes Model the World directly connects to: Fraction Relationships, Relationships Between Variables, Patterns Inside Numbers, Generalizing with Multiple Representations, Graphing Shapes Graphing Shapes directly connects to: Model the World, Generalizing with Multiple Representations, Relationships Between Variables, Distance & Direction, Nets & Surface (Continues on next slide) 41
Long Description for Slide 8 (3) Nets & Surface directly connects to: Graphing Shapes, Generalizing with Multiple Representations, Distance & Direction Distance & Direction directly connects to: Graphing Shapes, Nets & Surface Relationships Between Variables directly connects to: Variability in Data, The Shape of Distributions, Fraction Relationships, Patterns Inside Numbers, Generalizing with Multiple Representations, Model the World, Graphing Shapes Return to Slide 8 42
Long Description for Slide 9 The Why, How, and What of Learning Mathematics Drivers of Investigation (Why): In order to DI1. Make Sense of the World Understand and Explain; DI2. Predict What Could Happen (Predict); DI3. Impact the Future (Affect) Standards for Mathematical Practice (How): Students will SMP1. Make Sense of Problems and Persevere in Solving Them; SMP2. Reason Abstractly and Quantitatively; SMP3. Construct Viable Arguments and Critique the Reasoning of Others; SMP4. Model with Mathematics; SMP5. Use Appropriate Tools Strategically; SMP6. Attend to Precision; SMP7. Look for and Make Use of Structure; SMP8. Look for and Express Regularity in Repeated Reasoning Content Connections (What): While CC1. Reasoning with Data; CC2. Exploring Changing Quantities; CC3. Taking Wholes Apart, Putting Parts Together; and CC4. Discovering Shape and Space. Return to Slide 9 43
Long Description for Slide 10 A spiral graphic shows how the DIs, SMPs and CCs interact. The DIs are the Why, described as, In order to... : DI1. Make Sense of the World (Understand and Explain); DI2. Predict What Could Happen (Predict); DI3. Impact the Future (Affect). The SMPs are the How, listed under Students will... : SMP1. Make sense of problems and persevere in solving them; SMP2. Reason abstractly and quantitatively; SMP3. Construct viable arguments and critique the reasoning of others; SMP4. Model with mathematics; SMP5. Use appropriate tools strategically; SMP6. Attend to precision; SMP7. Look for and make use of structure; SMP8. Look for and express regularity in repeated reasoning. Finally, the CCs are the What, listed under, While... : CC1. Reasoning with Data; CC2. Exploring Changing Quantities; CC3. Taking Wholes Apart, Putting Parts Together; CC4. Discovering Shape and Space. Return to Slide 10 44
Long Description for Slide 14 (1) The graphic illustrates the connections and relationships of some fourth-grade mathematics concepts. Direct connections include the following: Number & Shape Patterns directly connects to: Shapes & Symmetries, Connected Problem Solving, Circles Fractions & Decimals, Factors & Area Models, Fraction Flexibility, Multi-Digit Numbers Shapes & Symmetries directly connects to: Connected Problem Solving, Circles Fractions & Decimals, Multi-Digit Numbers, Number & Shape Patterns Rectangle Investigations directly connects to: Connected Problem Solving, Measuring & Plotting, Circles Fractions & Decimals (Continues on next slide) 45
Long Description for Slide 14 (2) Connected Problem Solving directly connects to: Rectangle Investigations, Shapes & Symmetries, Number & Shapes Patterns, Multi-Digit Numbers, Circles Fractions & Decimals, Factors & Area Models, Measuring & Plotting Measuring & Plotting directly connects to: Connected Problem Solving, Rectangle Investigations, Visual Fraction Models Visual Fraction Models directly connects to: Measuring & Plotting, Circles Fractions & Decimals, Fraction Flexibility Factors & Area Models directly connects to: Connected Problem Solving, Circles Fractions & Decimals, Number & Shape Patterns, Multi-Digit Numbers, Fraction Flexibility (Continues on next slide) 46
Long Description for Slide 14 (3) Fraction Flexibility directly connects to: Factors & Area Models, Circles Fractions & Decimals, Number & Shape Patterns, Multi-Digit Numbers Multi-Digit Numbers directly connects to: Number & Shape Patterns, Shapes & Symmetries, Connected Problem Solving, Circles Fractions & Decimals, Factors & Area Models, Fraction Flexibility Circles Fractions & Decimals directly connects to: Multi-Digit Numbers, Number & Shape Patterns, Shapes & Symmetries, Rectangle Investigations, Connected Problem Solving, Visual Fraction Models, Factors & Area Models, Fraction Flexibility. Return to Slide 14 47
Long Description for Slide 23 A spiral graphic shows how the DIs, SMPs and CCs interact. The DIs are the Why, described as, In order to... : DI1. Make Sense of the World (Understand and Explain); DI2. Predict What Could Happen (Predict); DI3. Impact the Future (Affect). The SMPs are the How, listed under Students will... : SMP1. Make sense of problems and persevere in solving them; SMP2. Reason abstractly and quantitatively; SMP3. Construct viable arguments and critique the reasoning of others; SMP4. Model with mathematics; SMP5. Use appropriate tools strategically; SMP6. Attend to precision; SMP7. Look for and make use of structure; SMP8. Look for and express regularity in repeated reasoning. Finally, the CCs are the What, listed under, While... : CC1. Reasoning with Data; CC2. Exploring Changing Quantities; CC3. Taking Wholes Apart, Putting Parts Together; CC4. Discovering Shape and Space. Return to Slide 23 48
Long Description for Slide 26 (1) The graphic illustrates the connections and relationships of some seventh-grade mathematics concepts. Direct connections include: Angle Relationships directly connects to: Scale Drawings, 2D & 3D Connections, Populations & Samples, Proportional Relationships, Shapes in the World, Visualize Populations, Probability Models Scale Drawings directly connects to: 2D & 3D Connections, Graphing Relationships, Populations & Samples, Unit Rates in the World, Proportional Relationships, Visualize Populations, Probability Models, Angle Relationships Graphing Relationships directly connects to: Populations & Samples, Unit Rates in the World, Proportional Relationships, Probability Models, Scale Drawings (Continues on next slide) 49
Long Description for Slide 26 (2) 2D & 3D Connections directly connects to: Scale Drawings, Angle Relationships, Probability Models, Proportional Relationships, Visualize Populations, Shapes in the World, Populations & Samples Populations & Samples directly connects to: 2D & 3D Connections, Scale Drawings, Angle Relationships, Probability Models, Proportional Relationships, Visualize Populations, Shapes in the World, Unit Rates in the World, Graphing Relationships Unit Rates in the World directly connects to: Populations & Samples, Graphing Relationships, Scale Drawings, Proportional Relationships, Probability Models, Visualize Populations Shapes in the World directly connects to: Populations & Samples, 2D & 3D Connections, Proportional Relationships, Scale Drawings, Angle Relationships, Probability Models, Visualize Populations (Continues on next slide) 50
