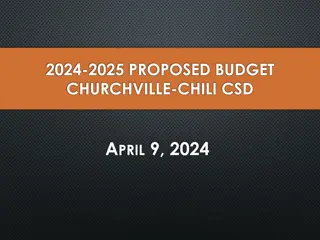
2024-2025 Proposed Final Budget Workshop Overview
The 2024-2025 proposed final budget workshop held on May 6, 2024, outlined the estimated actuals and budget details. The revenue breakdown from local, state, federal sources, and other financing sources was analyzed against expenditures, including salaries, benefits, and various services. Major impacts such as interest income, education funding, and flood expenses were highlighted. The budget summary compared actuals from previous years and projected figures for 2024-2025. Detailed flood expense summaries were also provided. Overall, the workshop focused on financial planning and allocation for the upcoming fiscal year.

Download Presentation

Please find below an Image/Link to download the presentation.
The content on the website is provided AS IS for your information and personal use only. It may not be sold, licensed, or shared on other websites without obtaining consent from the author. If you encounter any issues during the download, it is possible that the publisher has removed the file from their server.
You are allowed to download the files provided on this website for personal or commercial use, subject to the condition that they are used lawfully. All files are the property of their respective owners.
The content on the website is provided AS IS for your information and personal use only. It may not be sold, licensed, or shared on other websites without obtaining consent from the author.
E N D
Presentation Transcript
2024 - 2025 Proposed Final Budget Workshop May 6, 2024
2023-2024 Estimated Actuals 2023-2024 Estimated Actuals Budget to Estimate % % of Total 2023-2024 Budget $ Change Change Revenue Local Sources State Sources Federal Sources Other Financing Sources 12,916,720 $ 9,201,018 2,086,658 24,204,396 $ 13,516,974 $ 10,765,923 2,501,224 5,000,000 31,784,121 $ $ $ 600,254 1,564,905 414,566 5,000,000 7,579,725 4.6% 17.0% 19.9% 0.0% 31.3% 42.53% 33.87% 7.87% 15.73% - Total Revenue Expenditures Salaries & Benefits Instruction Support Services Operation of Non-Instructional Services Debt Service Other Financing Uses 16,089,195 $ 4,541,646 3,446,865 1,626,812 26,028,468 $ 15,409,158 $ 5,527,753 5,302,862 1,626,812 28,117,081 $ $ $ $ $ $ (125,000) $ 2,088,613 $ (680,037) 986,107 1,855,997 51,546 -4.2% 21.7% 53.8% 25.9% 0.0% -100.0% 8.0% 54.80% 19.66% 18.86% 0.89% 5.79% 0.00% 198,950 250,496 (0) 125,000 - Total Expenditures Revenue Over(Under) Expenditures (1,824,072) $ $ 3,667,040 $ 5,491,112
2023-2024 Major Impacts Interest Income higher interest rates (+ $440,000 est.) Basic Education Funding state budget passed many months after ours (+ $1,010,682 est.) Ready to Learn Block Grant additional $500,000 obtained through the assistance of Senator Schwank Insurance Proceeds Revenue Salary & Benefits - vacated positions remain unfilled or filled at lower salary & benefit level Special Education increase in outplaced students (16 to 33) Flood expenses - summary on next slide ARP ESSER HVAC Project pause Expenses
Flood Expense Summary EXPENSE COST EXPENSE COST Albright 499,319 Fence Rental 500 MPEC Electric Upgrade 2,420 Flood Legal Fees 65,725 Trinity UCC 36,084 Dumpsters 3,603 MPPC HVAC - Central Office 2,437 MSHS Platform 3,912 Carts/Supplies for Specialists 5,432 Ryder Truck Rental 56,318 Scoreboard move 1,221 Forklift and compressor rental 13,076 Storm Sewer 900 Fuel 1,133 Replacement Supplies 24,680 MSHS Winterizing 840 Portable Toilet Rental 2,240 District Internet Power Supply 3,554 Exterior Flood Cleanup 56,508 Misc tools, supplies, etc for moving & cleanup 20,211 Berks Fire Water Emergency Services 1,962 Staff Overtime through Summer 15,286 633,203 184,158 GRAND TOTAL SPENT TO DATE 817,360
2024-2025 Budget Summary Budget to Budget 2020-2021 Actuals 2021-2022 Actuals 2022-2023 Actuals 2023-2024 Budget 2024-2025 Budget % % of Total $ Change Change Revenue Local Sources State Sources Federal Sources Other Financing Sources 11,926,938 $ 7,661,590 864,853 224,300 20,677,681 $ 12,332,253 $ 7,942,014 1,334,316 21,611,082 $ 13,096,007 $ 9,912,597 2,247,129 25,273,795 $ 12,916,720 $ 9,201,018 2,086,658 24,204,396 $ 13,156,568 $ 11,140,734 739,634 25,036,936 $ 239,848 1,939,716 (1,347,024) 832,540 $ $ 1.9% 21.1% -64.6% 0.0% 3.4% 53.37% 38.01% 8.62% 0.00% 2,500 18,061 - - - Total Revenue Expenditures Salaries Benefits Purch. Professional Serv. Purch. Property Serv. Other Purchased Services Supplies Equipment Other Objects Debt Service Other Financing Uses Total Expenditures 7,445,712 $ 4,992,895 790,340 536,094 2,684,816 1,560,550 245,534 1,493,381 19,766,528 $ 7,942,350 $ 5,332,776 1,196,651 397,284 2,750,010 1,483,729 1,721,822 20,891,672 $ 8,295,723 $ 5,586,511 1,757,081 929,018 2,590,758 1,211,212 831,781 635,002 1,203,047 23,040,133 $ 9,511,537 $ 6,577,658 2,104,544 1,559,000 3,047,485 1,413,602 1,626,812 100,000 26,028,468 $ 10,548,757 $ 7,250,310 2,307,684 738,800 4,031,506 1,694,900 1,873,722 100,000 28,635,079 $ 1,037,220 $ 672,652 203,140 (820,200) 984,021 281,298 246,910 2,606,611 $ 10.9% 10.2% 9.7% -52.6% 32.3% 19.9% -16.7% 6.5% 15.2% 0.0% 10.0% 36.54% 25.27% 8.09% 5.99% 11.71% 5.43% 0.07% 0.27% 6.25% 0.38% 35,798 31,252 18,000 69,830 15,000 74,400 (3,000) 4,570 17,206 - - - - Revenue Over(Under) Expenditures $ 911,153 $ 719,411 2,233,662 $ (1,824,072) $ (3,598,143) $ (1,774,071) $
2024-2025 Discussion Items New Positions Transportation ESS Program Flood Expenses Special Education Fund Balance Tax Increase
Proposed New Positions BUILDING POSITION SALARY BENEFITS* TOTAL S&B High School 10 mo Assistant Principal 80,000.00 44,877.00 124,877.00 Middle School ELA Teacher 59,850.00 29,985.00 89,835.00 Science Teacher 59,850.00 29,985.00 89,835.00 Social Studies Teacher 59,850.00 29,985.00 89,835.00 Guidance Counselor 64,950.00 30,734.00 95,684.00 Elementary Second Grade Teacher 59,850.00 29,985.00 89,835.00 ELL Teacher 59,850.00 29,985.00 89,835.00 Special Education Teacher 59,850.00 29,985.00 89,835.00 District Wide Lead Teachers 26,850.00 3,905.00 30,755.00 *net of reimbursement
Staffing by Building Stony Creek Elementary Center Kerry C. Hoffman Education Center Antietam High School # of Grade Levels 4 5 4 # of Students* 360 431 373 # of 12 mo Administrators 0 2 1 # of 10 mo Administrators 2 0 1 # of 12 mo Secretaries 1 1 1 # of 10 mo Secretaries 0 1 1 # of Custodians 2.5 3 3.5 # of Teachers 25 28 23 # of Guidance Counselors 1 2 2 # of Nurses Additional Supports 1 1 1 Communities in Schools - Contracted Dean of Students - AEA Behavior Specialist - Contracted Effective School Solutions Program School Resource Officer shared by all bldgs * Based on current enrollment and estimated Kindergarten
Transportation Options Currently working with BCIU to upload all of our student information into their transportation software At a minimum, we will need to add 1 additional bus for K-3 = $51,040 for 24-25 Inability to double up runs due to start time and location of buildings Whatever the board decides, will affect parochial school transportation Administration recommends K-3 for 24-25, with a continual review to see if it can be expanded without an increase in cost
ESS Program Replaces Laurel Life Program Previous budget for Laurel Life = $255,000, budgeted for the last few years 24-25 Grants received for ESS = $144,279
2024-25 Flood Expenses Modular lease Reconfiguration of Buildings Replacement furniture
Special Education Increase in outside placements in current year Unknown new enrollments
BUDGET SUMMARY % Increase 28,635,079 $ 10.0% Proposed Expenditures 25,036,936 $ 3.4% Proposed Revenues 3,598,143 $ Additional Funding Necessary Yield of one mill of real estate taxes 245,303 $ 14.67 Budgetary Millage Increase Needed 46.31 Current Millage 3.61 7.8% Act 1 Adjusted Index Millage Value 49.92 Maximum Allowable Millage without exceptions
Fund Balance TYPE OF FUND BALANCE 2020-21 Actual 2021-22 Actual 2022-23 Actual 2023-24 Estimate 2024-25 Budget 2025-26 Budget Nonspendable - Prepaid Expenses $ 8,866 $ - $ - $ - $ - $ - Restricted - - - - - - Committed - PSERS 2,312,587 3,310,894 2,965,814 2,419,198 781,369 - Committed - Capital Proj 2,165,268 2,165,269 2,165,269 1,128,534 Assigned 1,844,206 1,478,992 1,824,072 3,598,143 2,000,000 2,000,000 Unassigned 1,892,671 1,987,855 2,056,249 2,262,171 1,900,000 1,718,104 Total Fund Balance 6,058,330 $ 6,777,741 $ 9,011,403 $ 10,444,781 $ 6,846,638 $ 4,846,638 $ Addition to Fund Balance 911,153 719,411 2,233,662 3,667,040 (3,598,143) (2,000,000) Budgeted Fund Balance Usage Positive (Negative) Variance (1,955,891) (1,844,206) (1,478,992) (1,824,072) (3,598,143) (2,000,000) 2,867,044 2,563,617 3,712,654 5,491,112 - -
Tax Increase Value of a Mill $ 245,303 2023-2024 Millage 46.31 2024-2025 New Bond Issue Millage Requirement 0.23 2024-2025 Millage included in Proposed Final Budget 46.54 ADDITIONAL MILLAGE OPTIONS Millage Increase Dollar Increase Fund Balance Usage Impact % Increase 3.61 7.8% 886,078.59 $ (2,712,064) $ Adjusted Act 1 Index 2.45 5.3% 602,079.04 (2,996,064) $ Base Index 1.50 3.31% 367,954.50 (3,230,189) $ Other Options: 1.25 2.76% 306,628.75 (3,291,514) $ 1.00 2.21% 245,303.00 (3,352,840) $ 0.75 1.66% 183,977.25 (3,414,166) $ 0.50 1.10% 122,651.50 (3,475,492) $ 0.25 0.55% 61,325.75 (3,536,817) $
May Board Agenda Motions Finance 2024-2025 Proposed Final Budget Adoption Policy Transportation Change from K-6 to K-3 Position Changes New Positions Personnel
NEXT STEPS Monday 5/6 Budget Workshop 2023-2024 estimated revenue & expenses 2024-2025 budget update Monday 5/13 C.o.W. 2024-2025 budget update Monday 5/20 Voting 2024-2025 Food Service Budget 2024-2025 budget update Budget Review May 20 Proposed Final Budget Adoption June 24 Final Budget Adoption Board Actions