3 Key Questions in Patient Number Communication
In healthcare, it's crucial to consider the outcome, relevance, and context when presenting numerical information to patients. Understanding these elements enhances communication efficacy and patient engagement.

Uploaded on Mar 03, 2025 | 4 Views
Download Presentation

Please find below an Image/Link to download the presentation.
The content on the website is provided AS IS for your information and personal use only. It may not be sold, licensed, or shared on other websites without obtaining consent from the author.If you encounter any issues during the download, it is possible that the publisher has removed the file from their server.
You are allowed to download the files provided on this website for personal or commercial use, subject to the condition that they are used lawfully. All files are the property of their respective owners.
The content on the website is provided AS IS for your information and personal use only. It may not be sold, licensed, or shared on other websites without obtaining consent from the author.
E N D
Presentation Transcript
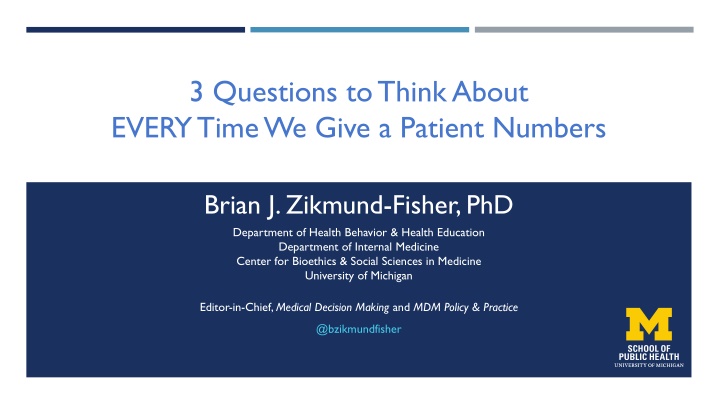
3 Questions to Think About EVERY Time We Give a Patient Numbers Brian J. Zikmund-Fisher, PhD Department of Health Behavior & Health Education Department of Internal Medicine Center for Bioethics & Social Sciences in Medicine University of Michigan Editor-in-Chief, Medical Decision Making and MDM Policy & Practice @bzikmundfisher
3 Questions to Remember 1. What outcome are you trying to accomplish? 2. Are the numbers what they need? 3. Are the numbers contextualized?
A Taxonomy of Number Communication Outcomes: I Identification Recall Contrast Categorization Computation Can I find the right number? Can I remember the number? Can I tell which number is largest or smallest? Can I appropriately categorize the number? Can I do computations with the number? Ancker, et al., Taxonomies for synthesizing the evidence on communicating numbers in health: Goals, format, and structure. Risk Analysis 2022. Ancker, et al., Do you want to promote recall, perceptions, or behavior? The best data visualization depends on the communication goal. Journal of the American Medical Informatics Association, 2023.
A Taxonomy of Number Communication Outcomes: II Probability perceptions Do I see the number (or number difference) as larger or smaller? Does the number (or number difference) make me feel more or less? Do I notice when the number changes? Does the number make me want to do something? Does the number make me do something? Do I like the number presented this way? Do I trust the number? Probability feelings Discrimination Behavioral intentions Behavior Preference Trust Ancker, et al., Taxonomies for synthesizing the evidence on communicating numbers in health: Goals, format, and structure. Risk Analysis 2022. Ancker, et al., Do you want to promote recall, perceptions, or behavior? The best data visualization depends on the communication goal. Journal of the American Medical Informatics Association, 2023.
Example: Cardiovascular risk calculator I want to have people remember their likelihood of heart attack or stroke? believe that the calculator provides trustworthy information? know if they are at high risk? have a higher perceived risk of heart attack or stroke? go see their doctor or take actions if they are at high risk?
Example: Risk reduction from PrEP for HIV I want to accurately remember the size of the risk reduction from using PrEP? perceive PrEP to be effective at reducing risk of getting HIV? be less worried about getting HIV if they use PrEP? be motivated to use PrEP?
3 Questions to Remember 1. What outcome are you trying to accomplish? 2. Are the numbers what they need? 3. Are the numbers contextualized?
What your audience needs to do What a number communication can actually do The Sweet Spot!
Did You Know? Telling someone that a side effect is rare makes them more worried than if you told them it happens in 1% of cases? In fact, on average, they interpret rare to mean about 9%! 10
Verbal Descriptors of Probability 10 high-credibility studies of the EC verbal risk descriptors tended to find that perceived probability and/or negative emotion was higher with verbal descriptors than with the corresponding probability numbers (%, 1 in X, or common- denominator rates). Berry, Raynor, & Knapp., Psychology, Health & Medicine, 2003 11
Did You Know? If you say there s a 1 in 100 chance, most people perceive this as bigger than a 1% chance? 12
A Simple (?) Question Which of the following numbers represents the biggest risk of getting a disease? - 1 in 100 - 1 in 1000 - 1 in 10 20% of a college-educated US sample got this wrong Lipkus IM, Samsa G, Rimer BK. General performance on a numeracy scale among highly educated samples. Medical Decision Making. 2001.
Grimes and Snively, 1999 Which risk is bigger: 2.6 per 1000, or 8.9 per 1000? Which risk is bigger: 1 in 384 or 1 in 112? 56% of women chose the correct answer 73% of women chose the correct answer Grimes, D. A. and G. R. Snively (1999). "Patients' understanding of medical risks: Implications for genetic counseling." Obstetrics and Gynecology 93: 910-914.
Avoid Using 1-in-X Formats (Unless Being Persuasive) Using 1-in-X (vs. rates out of 100 / 1000) increases probability perceptions / feelings 22 RCTs: 14 significant effects, 9 no effect, 0 reverse direction Using 1-in-X (vs. rates out of 100 / 1000) decreases ability to contrast risks (i.e., find the largest or smallest) 4 RCTs: 2 significant effects, 2 no effect, 0 reverse direction Ancker, et al., How point (single-probability) tasks are affected by probability format, part 1: a Making Numbers Meaningful systematic review. MDM Policy & Practice, In press. Ancker, et al., How point (single-probability) tasks are affected by probability format, part 2: a Making Numbers Meaningful systematic review. MDM Policy & Practice, In press.
Just say No to 1-in-X The traditional use of proportions [e.g., 1 in 384 vs. 1 in 112], to express risk in genetic counseling lacks scientific basis. Grimes & Snively, 1999, Obstetrics and Gynecology If a clinician intentionally prescribes a medication or surgical therapy known to cause harm when an alternative that has proven to be both safer and more effective is clearly identified and readily available, most people will express concern about that clinician s decision making. Given the current state of evidence from Pighin and others, any continued use of 1-in- X formats to communicate medical risk to patients is similarly intolerable. Zikmund-Fisher, 2010, Medical Decision Making
An Evidence-Supported Risk Graphic Called icon array smiley faces What is this called? pictograph smiley icons pictogram population/crowd figures emoticons population figures face pictogram population diagram bathroom figures 100 faces restroom icons frequency format stick figures people charts block chart matrix of 100 elements wall of women glyph-based representation 100 representative faces Paling Palettes crowd chart 1000-people histogram crowd-figure-pictogram pictorial display Cates plot Kuiper-Marshall personographs ....
Do You Perceive these Risks the Same? >> 8% > 18 Ancker, et al., How point (single-probability) tasks are affected by probability format, part 2: a Making Numbers Meaningful systematic review. MDM Policy & Practice, In press.
Did You Know? People will remember 32% better if it is shown: like this ...instead of like this BUT: Icon type does NOT change perceived probability 19 Ancker, et al., How point (single-probability) tasks are affected by probability format, part 1: a Making Numbers Meaningful systematic review. MDM Policy & Practice, In press. Ancker, et al., How point (single-probability) tasks are affected by probability format, part 2: a Making Numbers Meaningful systematic review. MDM Policy & Practice, In press.
Icon Arrays Highlight Absolute Differences Zikmund-Fisher BJ, Fagerlin A, Ubel PA, A demonstration of less can be more in risk graphics. Medical Decision Making, 2010.
Iconarray.com Free, online risk graphics generator 1+ outcomes / array Up to 3 arrays in a set Customizable colors, icons, titles and legends Several array structures Incl.: 25 x 40 (1000 unit) arrays
3 Questions to Remember 1. What outcome are you trying to accomplish? 2. Are the numbers what they need? 3. Are the numbers contextualized?
Ways to Contextualize Data Normal/healthy references Comparisons (absolute differences) Action thresholds / goal ranges Categories Range of variation Clinically important differences Zikmund-Fisher BJ. Policy Insights from the Behavioral and Brain Sciences, 2019.
Action Thresholds https://www.uspreventiveservicestaskforce.org/uspstf/rec ommendation/statin-use-in-adults-preventive-medication https://www.cvriskcalculator.com/
Table vs. Number Line Zikmund-Fisher BJ, et al. Graphics help patients distinguish between urgent and non-urgent deviations in laboratory test results. Journal of the American Medical Informatics Association 2017;24(3):520-528.
Hemoglobin A1c Unpublished graphic from 1 R01 HS021681, BJ Zikmund-Fisher, Principal Investigator.
Scale Matters Unpublished graphics from 1 R01 HS021681, BJ Zikmund-Fisher, Principal Investigator.
Goals for Test Results Scherer AM, Witteman HO, Solomon J, Exe NL, Fagerlin A, Zikmund-Fisher BJ. Improving understanding of test results by substituting (not adding) goal ranges: experimental study. Journal of Medical Internet Research, 2018.
Harm Anchors Many doctors are not concerned until here Zikmund-Fisher BJ, Scherer AM, Witteman HO, Solomon J, Exe NL, Fagerlin A. Providing harm anchors in visual displays of test results can mitigate patient perceptions of urgency about near-normal values. Journal of Medical Internet Research, 2018.
Health data communications are ALWAYS biased and, frankly, manipulative!
3 Questions to Remember 1. What outcome are you trying to accomplish? 2. Are the numbers what they need? 3. Are the numbers contextualized? Thank you! @bzikmundfisher


 Question")

")