7th Grade Math Focus: Statistics and Probability Unit | Weekly Overview
Stay informed with the 7th grade math weekly overview on statistics and probability unit. Topics covered include random sampling, data inferences, and comparative analysis. Engage with your child's learning journey by reviewing the provided resources together.

Download Presentation

Please find below an Image/Link to download the presentation.
The content on the website is provided AS IS for your information and personal use only. It may not be sold, licensed, or shared on other websites without obtaining consent from the author. If you encounter any issues during the download, it is possible that the publisher has removed the file from their server.
You are allowed to download the files provided on this website for personal or commercial use, subject to the condition that they are used lawfully. All files are the property of their respective owners.
The content on the website is provided AS IS for your information and personal use only. It may not be sold, licensed, or shared on other websites without obtaining consent from the author.
E N D
Presentation Transcript
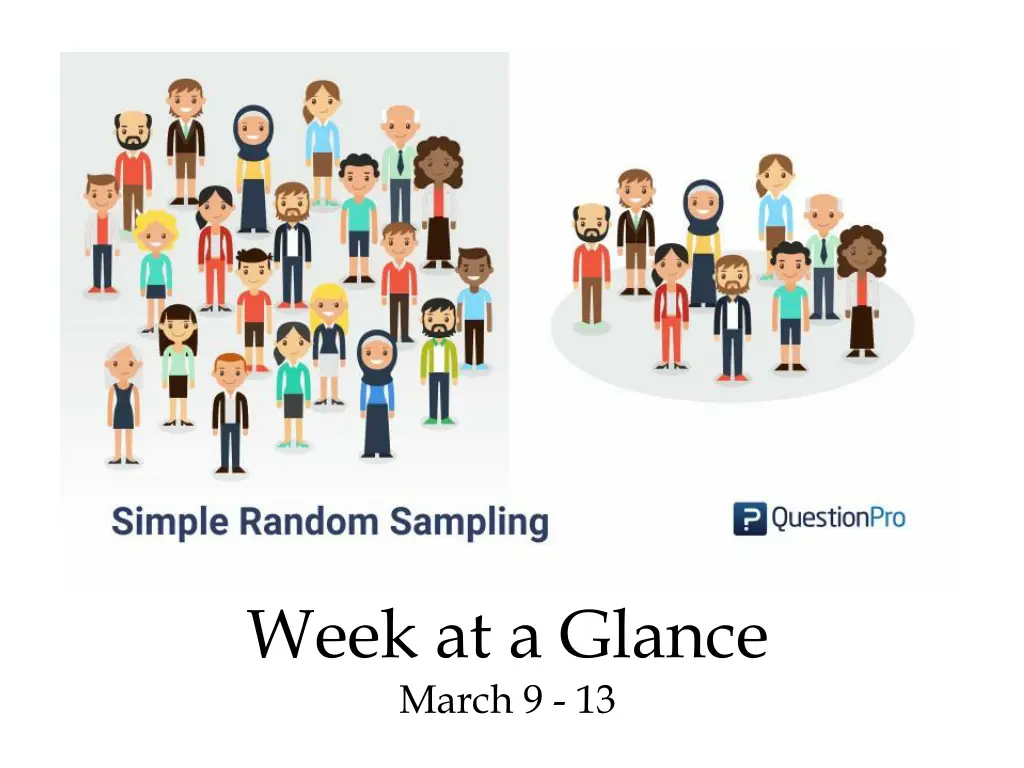
Week at a Glance March 9 - 13
Dear Parents, This week at a glance (WAG) is designed to give parents a brief idea of what their child is learning at school. It will have the subject standards (Georgia Standards of Excellence), the main topics covered, and some sample problems with links to videos and worksheets. We encourage parents and students to review this presentation together and to stay informed on the weekly learning objectives.
Our Weekly Focus this week will be Review Week for Benchmark #3
7th Grade Math Standards ( Unit 5 Statistics and Probability ) MGSE7.SP.1 Understand that statistics can be used to gain information about a population by examining a sample of the population; generalizations about a population from a sample are valid only if the sample is representative of that population. Understand that random sampling tends to produce representative samples and support valid inferences. MGSE7.SP.2 Use data from a random sample to draw inferences about a population with an unknown characteristic of interest. Generate multiple samples (or simulated samples) of the same size to gauge the variation in estimates or predictions. For example, estimate the mean word length in a book by randomly sampling words from the book; predict the winner of a school election based on randomly sampled survey data. Gauge how far off the estimate or prediction might be. Draw informal comparative inferences about two populations. MGSE7.SP.3 Informally assess the degree of visual overlap of two numerical data distributions with similar variabilities, measuring the difference between the medians by expressing it as a multiple of the interquartile range. MGSE7.SP.4 Use measures of center and measures of variability for numerical data from random samples to draw informal comparative inferences about two populations. For example, decide whether the words in a chapter of a seventh grade science book are generally longer than the words in a chapter of a fourth grade science book.
Monday, March 9 Warm-up: Equations and Missing Angles Opening: Math Video: Random Sample Standard:. MGSE7.SP.2 Use data from a random sample to draw inferences about a population with an unknown characteristic of interest. Generate multiple samples (or simulated samples) of the same size to gauge the variation in estimates or predictions. Work Period: Closing: Class Review
Tuesday, March 10 Warm-up: Equations and Missing angles Opening: Collecting data via survey to make inferences or predictions. Standard:. MGSE7.SP.2 Use data from a random sample to draw inferences about a population with an unknown characteristic of interest. Generate multiple samples (or simulated samples) of the same size to gauge the variation in estimates or predictions. Work Period: Computer Lab (i-Ready) Review for Benchmark #3 Closing: Class Review
Wednesday, March 11 Warm-up: Mixed Problems Opening: Collecting data via survey to make inferences or predictions. Standard:. MGSE7.SP.3 Informally assess the degree of visual overlap of two numerical data distributions with similar variabilities, measuring the difference between the medians by expressing it as a multiple of the interquartile range. Work Period: Review for Benchmark #3 Closing: Students Review
Thursday, March 12 Warm-up: Integers Opening: Collecting data via survey to make inferences or predictions. Standard:. MGSE7.SP.3 Informally assess the degree of visual overlap of two numerical data distributions with similar variabilities, measuring the difference between the medians by expressing it as a multiple of the interquartile range. Work Period: Computer Lab (i-Ready, USATestPrep, Virtual Nerd) Closing: Class Review
Friday, March 13 Warm-up: Volume Opening: Actually collect data based on survey question from class, grade, or school) Standard:. MGSE7.SP.4 Use measures of center and measures of variability for numerical data from random samples to draw informal comparative inferences about two populations. For example, decide whether the words in a chapter of a seventh grade science book are generally longer than the words in a chapter of a fourth grade science book. Work Period: Introduce Math Project; Review for Benchmark #3 Closing: Class Review
Simple Random Sampling Techniques for generating a simple random sample Math Antics - Basic Probability
Click on links to open worksheet Random Sampling Matching Worksheet Random Sampling WS
Math Help If your child is struggling with Math you may want to consider these apps photomath Quick Maths Middle School Math HD Math Tango Math Practice Math vs Zombies