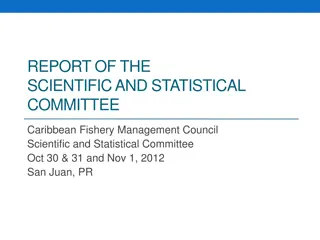
Explore the key concepts of the ABC (Acceptable Biological Catch) Control Rule in fisheries management, including setting OFL and ABC, catch limits, and the 4-tiered system for data assessment. Learn how this system helps manage fishing activities sustainably while accounting for scientific uncertainty and data quality.
Please find below an Image/Link to download the presentation.
The content on the website is provided AS IS for your information and personal use only. It may not be sold, licensed, or shared on other websites without obtaining consent from the author. If you encounter any issues during the download, it is possible that the publisher has removed the file from their server.
You are allowed to download the files provided on this website for personal or commercial use, subject to the condition that they are used lawfully. All files are the property of their respective owners.
The content on the website is provided AS IS for your information and personal use only. It may not be sold, licensed, or shared on other websites without obtaining consent from the author.
Setting OFL and ABC Overfishing Limit (OFL): Catch expected when fishing at a level that will achieve the maximum sustainable yield (MFMT) SSC ABC Control Rule Acceptable Biological Catch (ABC): Catch reduced below OFL to account for scientific uncertainty (catch with less than a 50% probability of exceeding the true OFL) Catch (lbs) Annual Catch Limit (ACL): Catch that invokes accountability measures Increasing Council Annual Catch Target (ACT): Catch reduced below ACL to account for management uncertainty or achieve optimum yield U.S. Department of Commerce | National Oceanic and Atmospheric Administration | NOAA Fisheries | Page 3
Catch in Tons of a Stock Increasing Sustainable Yield (Catch) Overfished or Overfishing Overfishing Limit Fishing Effort (or Stock Biomass)
ABC Control Rule: 4-Tiered System Tier 1 Data rich full assessment Tier 2 Data moderate full assessment Tier 3 Data limited assessment Tier 4 Catch only information
ABC Control Rule: 4-Tiered System Multiple tiers enable the SSC and Council to establish catch limits across a wide range of data quality situations for all stocks. This incentivizes efforts to obtain better information for data-limited stocks. ABC buffer increases in size due to increasing uncertainty in each descending tier. In other words, the control rules is designed to be more conservative when uncertainty is higher.
Setting MSY, OFL, ABC 0.5 Assessment gives the distribution of OFL (probability density function = PDF) 0.4 Probability Density 0.3 Distribution of OFL Defined by: Mean Variance ( ) or CV 0.2 0.1 0 200 20 40 60 80 100 120 140 160 180 OFL (1,000 lbs)
Setting MSY, OFL, ABC 50% Probability MSY } = Buffer: Risk of Overfishing* 0.5 0.4 *Risk of overfishing = Level of risk that the council is willing to accept that overfishing will not occur. Set by CFMC. Probability Density 0.3 Where is Scientific Uncertainty? 0.2 Two approaches: Variance Buffer 0.1 ABC MSY 0 200 20 40 60 80 100 120 140 160 180 OFL (1,000 lbs)
Setting MSY, OFL, ABC is a measure of uncertainty in OLF 0.5 0.4 Probability Density 0.3 1 0.2 0.1 2 0 200 20 40 60 80 100 120 140 160 180 OFL (1,000 lbs)
Setting MSY, OFL, ABC is a measure of uncertainty in OLF 0.5 0.4 Probability Density 0.3 > > 0.2 0.1 0 200 20 40 60 80 100 120 140 160 180 OFL (1,000 lbs)
Setting MSY, OFL, ABC 50% Probability MSY } = Buffer: Risk of Overfishing 0.5 0.4 Probability Density 0.3 0.2 0.1 MSY 0 ABC 200 20 40 60 80 100 120 140 160 180 OFL (1,000 lbs)
Setting MSY, OFL, ABC 50% Probability MSY } = Buffer: Risk of Overfishing Distribution of OFL Defined by: Mean Variance ( ) or CV 0.5 0.4 Probability Density 0.3 0.2 0.1 ABC MSY 0 200 20 40 60 80 100 120 140 160 180 OFL (1,000 lbs)
Tier 1 Data Rich Condition for Use: Full stage-structured assessment where reliable time series on (1) catch, (2) stage composition and (3) index of abundance are available and the assessment provides estimates of MSST, MFMT, and PDF of OFL Minimum Stock Size Threshold (MSST) = 0.75*SSBMSY (or proxy) Maximum Fishing Mortality Threshold (MFMT) = FMSY (or proxy) MFMT = FMSY , MSY = Long-term Yield at MFMT1 OFL = Yield at MFMT 1 Assuming the spawner-recruit relationship is well estimated, otherwise undefined.
Tier 1 Data Rich ABC = x= OFL as reduced by scientific uncertainty and risk of overfishing . The reduction factor is applied to the PDF of OFL, where the PDF is determined from the assessment (where > min ) Scalar if B > Bmsy Scalar * (B-Bcritical )/ (Bmsy- Bcritical) if B < B msy ABC*= d(x) where d = Where: Scalar is = 1 if risk of overfishing is specified (<0.5), <1 if not specified (=0.5) Bcritical is defined as the minimum level of depletion at which fishing would be allowed. Scientific uncertainty would take into account, but not be limited to, the species life history and ecological function. Risk of overfishing determined by Council min could be equal to coefficient of variation; min is in a log scale
Setting MSY, OFL, ABC 50% Probability MSY } = Buffer: Risk of Overfishing 0.5 0.4 Probability Density 0.3 0.2 0.1 MSY 0 ABC 200 20 40 60 80 100 120 140 160 180 OFL (1,000 lbs)
OFL = Fmsy* B Catch Level Recommendation ABC =Fmsy* B * P P = Probability of overfishing P < 0.5 BMSY Bcritical Depletion level
Tier 2 Data Moderate Condition for Use: Data-moderate approaches where two of the three time series (catch, stage composition and index of abundance) are deemed informative by the assessment process, and the assessment can provide MSST, MFMT, and PDF of OFL Same as Tier 1, but variation of the PDF of OFL ( ) must be greater than 1.5 min (in principle there should be more uncertainty with data- moderate approaches than data-rich approaches).
Tier 3 Data Limited Quantitative Assessments Condition for use: Relatively data-limited or out-of-date assessments MFMT = FMSY (or proxy such as F40%) MSST = unknown OFL = catch at MFMT ABC determined from OFL as reduced by scientific uncertainty and risk of overfishing a. Where the reduction factor is applied to the PDF of OFL when the PDF is determined from the assessment (with > 2 min), OR b. Where ABC = reduction factor * OFL, where reduction factor must be < 0.9 Scientific uncertainty would take into account, but not be limited to, the species life history and ecological function, the perceived level of depletion, and vulnerability of the stock to collapse. Risk of overfishing determined by Council
Tier 4: Landings & Ancillary Information (e.g. , Productivity-Susceptibility Analyses, Expert opinion) 4a Condition for use: No accepted assessment, but stock unlikely to be subject to overfishing, and not likely to be overfished. If SSC consensus cannot be reached on the use of Tier 4a, Tier 4b should be used. MSST, MFMT, MSY = unknown OFL = Scalar * 75th percentileof reference period landings Scalar =< 2 depending on perceived degree of exploitation, life history and ecological function ABC = buffer * OFL, where buffer must be < 0.9 (e,g, 0.9, 0.8, 0.75, 0.70 ) 4b Condition for use: No accepted assessment, but stock likely subject to overfishing and/or overfished or unclear. MSST, MFMT, MSY = undefined OFL = Scalar * mean of recent landings (most recent three years of available landings) Scalar < 1 depending on perceived degree of exploitation, life history and ecological function ABC = buffer * OFL, where buffer must be < 0.9 (e,g, 0.9, 0.8, 0.75, 0.70 )
Recommendations: ABC CR The SSC recommends a workshop for on how life history parameters and ecological function would be used as input into the MSE and FMSY proxies, such as %SPR and MSY proxies and or scalar. The SSC recommends a workshop for Council members on risk policy and proposed control rules (e.g., setting the risk of overfishing).
SEDAR 46 Data Limited Methods Two Parts Develop a Management Strategy Evaluation (MSE) Assessing model performance relative to Performance Criteria Apply models as a test of Data-limited Tool Kit How do models perform across different data sets
Hypothetical Output of Data limited Models PDF of Catch for each model Catch at Median OFL Multiple models: Choose 1 or Combine Model 1 Model 2 Combined Model Density Density Catch Recommendation (lbs) Catch Recommendation (lbs)
Species sorted by average annual commercial landings for each island unit Species evaluated 6 species-island units 2 per island unit Species selection decided by SEDAR process Designed to present a range of data quality & quantity
Management Strategy Evaluation Designed to evaluate model performance Incorporates best information (previously vetted by the data work groups) on: Species life-history, CPUE, etc. Expected range of variability (confidence) in the data. Data used to simulate known population, which is then used to evaluate model performance.
Management Strategy Evaluation Designed to evaluate model performance against Performance Criteria (Selected by SEDAR 46 DW/AW Panel, SSC) PNOF: Probability of Not Overfishing (NSG1) B50: Probability of Not Being Overfished (NSG1) AAVY: Probability of Low Variability in Yield LTY: Long-term Yield (Last 5 years) STY: Short-term Yield (First 5 years) Simulations run for 40 years Meeting performance criteria only indicates a model is robust due to uncertainty given the model inputs (e.g., life history characteristics)
Management Strategy Evaluation Example MSE Output: Model Performance relative to Simulated Population using Data based on Spiny Lobster (STT) August SSC Runs: LFS, Imprecise Biased, Then et al. (2015) M, LVB Correlations, Steepness range = AW, RW Performance Criteria MP PNOF B50 LTY AAVY STY FMSYref 62 93 68 99 48 IslopeOFL 69 85 24 94 34 Islope1 69 85 24 93 34 Islope4 69 85 23 95 33 YPR_ML_LVBcor 55 70 19 94 45 SPR40_ML_LVBcor 34 51 17 94 57 SPR30_ML_LVBcor 21 39 13 91 63 CC4 67 82 13 88 27 CFMC 1 29 10 51 72
Management Strategy Evaluation August SSC Runs: LFS, Imprecise Biased, Then et al. (2015) M, LVB Correlations Example MSE Output: Model Performance relative to Simulated Population using Data based on Queen Triggerfish (STT) August SSC Runs: LFS, Imprecise Biased, Then et al. (2015) M, LVB Correlations FMSYref 85 Method PNOF B50 Performance Criteria LTY AAVY STY 99 78 94 56 Method PNOF B50 LTY AAVY STY FMSYref SPR30_ML_LVBcor 85 31 99 84 78 72 94 99 56 60 SPR30_ML_LVBcor CFMC 31 11 84 85 72 67 99 93 60 74 CFMC SPR40_ML_LVBcor 11 52 85 89 67 59 93 98 74 45 SPR40_ML_LVBcor Islope4 52 74 89 97 59 48 98 99 45 45 Islope4 Islope1 74 73 97 97 48 46 99 99 45 45 Islope1 IslopeOFL 73 73 97 97 46 45 99 99 45 45 YPR_ML_LVBcor 72 95 44 97 29 IslopeOFL 73 97 45 99 45 YPR_ML_LVBcor 72 95 44 97 29
SSC Comments on SEDAR 46 The SSC commends the SEFSC on the work conducted for SEDAR 46 with respect to the scope, quantity and quality of the work performed. The SSC is excited about the MSE approach and the potential for the Data-limited Toolkit to provide management advice (i.e., OFL guidance). The SSC finds the management strategy evaluation (MSE) to represent the best available science.
SSC Comments on SEDAR 46 The SSC recognizes the value of this approach for future use and has specific recommendations for improvements. Given the time available, especially in light of important competing agenda items, the SSC felt limited in its ability to evaluate the results of SEDAR 46 SSC needed more discussion of the models that came out of the MSE SSC needed more discussion of the rationale for making a choice between those models, where necessary. Future presentation(s) should be provided in an oversimplified manner for context prior to full review.
SSC Comments on SEDAR 46 The SSC does not believe the results of the application (i.e., species assessments) can be used for management, at this time, due to couple of factors. The SSC was concerned about: 1. what appeared to be a discrepancy between expected performance from the MSE and the resulting catch recommendations from the application, 2. the differences in the magnitude of the catch recommendations from the two model classes. An explanation describing the discrepancies was not available, and the SSC did not fully evaluate the methodology of the application.
SSC Comments on SEDAR 46 The SSC recommends the following: 1. Tune the operating model to the observations from the fishery or demonstrate why such treatment is not going to affect the application of the methods for each species (e.g., input an observed effort time-series to condition fishing mortality). 2. Re-evaluate the range of depletion inputs in the MSE. The SSC was particularly concerned with the range of depletion used for lobster. 3. To avoid confusion, methods that do not meet the performance metric criteria should not be presented 4. Further work on performance metrics (presentation of full distribution of all performance metrics) 5. More robust treatment of the indices as indicated by the CIE reviewers or demonstrate why such treatment is not going to affect the application of the methods.