ABO Blood Types and Cardiovascular Health Exploration
A comprehensive overview of ABO blood types, genetics, associations with cardiovascular disease, and distributional variances across populations. Genetic data, haplotype estimation, and future research insights are discussed.

Download Presentation

Please find below an Image/Link to download the presentation.
The content on the website is provided AS IS for your information and personal use only. It may not be sold, licensed, or shared on other websites without obtaining consent from the author.If you encounter any issues during the download, it is possible that the publisher has removed the file from their server.
You are allowed to download the files provided on this website for personal or commercial use, subject to the condition that they are used lawfully. All files are the property of their respective owners.
The content on the website is provided AS IS for your information and personal use only. It may not be sold, licensed, or shared on other websites without obtaining consent from the author.
E N D
Presentation Transcript
ABO BLOOD TYPES IN MESA Nicholas Larson, PhD Assistant Professor of Biostatistics Department of Health Sciences Research Mayo Clinic College of Medicine
2 Outline Background and Genetics of ABO MESA ABO Genetic Data Haplotype Estimation and ABO Allele Assignment Distributional Characteristics of ABO in MESA Associations with ABO and Cardiovascular Phenotypes Conclusions and Future Work
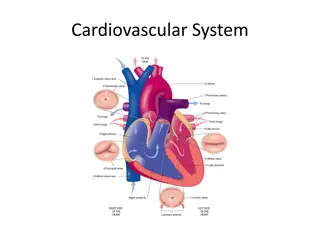
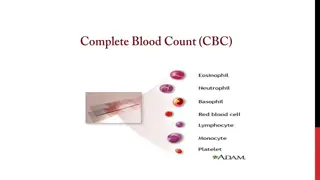
3 (Brief) Biology of ABO Red Blood Cell Genotype The ABO system relates to the presence of A and/or B antigens on the surface of red blood cells (RBCs) ABO glycotransferases modify terminal ends of the H precursor antigen TYPE O (O,O) A (A,O) (O,A) (A,A) A A TYPE A A A ABO gene (ABO) is tri-allelic A, B, and O alleles B B (B,O) (O,B) (B,B) TYPE B B B A and B alleles of ABO are genetically co- dominant Both antigens present on RBC for Type-AB O-allele lacks transferase ability Type-O necessarily homozygous for O-alleles B A B B A B A B (A,B) (B,A) TYPE AB A A B
4 ABO and Cardiovascular Disease (CVD) There is a substantial publication history* of ABO blood type (and ABO SNPs) associated with CVD phenotypes Non-O with risk of venous thromboembolism (VTE), stroke Findings for myocardial infarction (MI) have been inconsistent ABO is functionally related to von Willebrand factor (VWF), which is associated with thrombosis ABO glycotransferases directly modify VWF oligosaccharides in similar fashion to RBC H precursor antigens Non-O blood groups have higher plasma levels of VWF Biological mechanism between ABO and CVD hypothesized to be combination of: Influence on VWF levels General ABO glycotransferase impact on cardio-metabolic pathways *See: Zhang et al. (2012), IJVM 2012:641917.
5 Differences in ABO Distributions ABO allele frequencies (and thus blood types) differ greatly by population/geography Driving force behind these differences is not well understood Image Source: A. E. Mourant et.al., The Distribution of the Human Blood Groups and Other Polymorphisms, 2nd ed. (1976) Distributional discrepancies in ABO Type across race may be relevant to racial differences in disease incidence
6 Genetics of ABO Genetic sequence and structure of ABO determined in the mid-1990s ABO (18 kb) Relative to A101 as a genetic reference: A2-allele has frameshift mutation c.1061C>Del B-allele characterized by a number of key amino acid (AA) substitutions O-alleles: Transferase activity disabled in via either c.261G>Del (e.g., O01) OR 2 key AA substitutions (e.g., O03) The NCBI Blood Group Antigen Gene Mutation Database (BGMUT) catalogs variation of blood group antigen genes, including ABO Currently lists 179 genetically unique ABO alleles Image Source: Seltsam et al. (2003), Blood, 102(8)
7 Genetic ABO Profiling ABO blood typing is traditionally conducted via serologic testing However, direct interrogation of key functional variation and high linkage disequilibrium in ABO results in highly accurate ABO genetic profiling Successfully applied in multiple studies (e.g., Yip et al. 2000) GOAL: Genetically determine ABO blood types in MESA Characterize ABO distributions by race Evaluate associations with cardiovascular phenotypes
8 MESA ABO Genetic Data Previously merged genotype data from the three (3) Illumina chips (i.e., chip data ) Exome BeadChip, Cardio-MetaboChip, and iSelect IBC Chip ~100 SNVs across ABO locus However, key functional variation required for ABO genetic profiling missing Designed a custom Sequenom Panel including 10 ABO variants Run on 6316 MESA subjects Key deletions at c.261 and c.1059 Supplement Sequenom variants with chip data in analysis
9 Sequenom QC Summary Variant-level QC by HWE, call rate (>90%) 4 ABO variants failed (non-critical, 3 already in chip data) Sample-level QC by panel call rate ( 75%): 61 failures AFA EUR HIS CHN TOT 1638 1617 760 751 2487 2471 2446 (99%) 1407 (99%) 6189 (99%) 1431 1416 6316 6255 On Sequenom QC Passed w/ Chip Data 1590 (98%) 746 (99%) Three (3) SNPs (rs8176746, rs1053878, rs7853989) on Sequenom panel were also in the chip data Seven total samples had conflicting genotypes for at most 1 SNP Preference given to Sequenom genotype Total of 28ABO coding variants used for analysis
10 ABO Genotable for Major Alleles Genetic Variants Used for MESA ABO Typing Exon 2 3 4 5 6 7 1061 CDS Position 190 703 103 106 188 189 220 261 297 318 467 488 526 542 579 595 646 657 681 729 768 771 796 803 930 46 53 In Sequenom A101 (ref.) G G G G G C G C G A C C C C G T C T C G G C C C C G G C A102 T Common ABO Alleles A201 T - B101 G G T A A C A O01 - O02 T A T T - G A A T T O03 G T G = Deletion = In both data sources -
11 Haplotype Estimation Methods Un-phased genotypes represent incomplete information Do not directly observe phased haplotypes (i.e., alleles) To translate ABO genotype vectors into estimated haplotypes, we applied an expectation-maximization (EM) algorithm from the R statistical package haplo.stats De novo allele frequency estimation via statistical phasing Can accommodate missing genetic data Analyses stratified by race (i.e., race-specific hap s and freq s) Additionally provides posterior probabilities (PPr) of haplotype pairs (i.e., diplotypes) per subject Assigned MESA diplotypes based on PPr > 0.90
12 Assigning Haplotypes to ABO Alleles Applied BGMUT genotable to map haplotypes ABO alleles For observed MESA haplotypes not in BGMUT, novel ABO alleles were assigned under a hierarchical rubric: Deletion at c.261G>Del Novel O Remaining with c.1061C>Del Novel A2 Remaining with ACA haplotype at c.796-803-930 Novel B Remaining Unknown When multiple ABO alleles had same haplotype pattern in BGMUT, preference given to most common E.g., A201 vs. A213 or O02 vs. O65
13 MESA ABO Allele Frequencies Allele frequencies differ greatly by race EUR and HIS were closest in frequencies Frequency Estimates Allele AFA CHN EUR HIS A101 0.03 0.08 0.20 0.13 A102 0.04 <0.01 0.01 0.17 A A201 0.00 0.04 0.06 0.07 Sum of type-unknown frequencies in AFA ~ 1% High percentage of novel O alleles (15.4%) A (other) <0.01 <0.01 <0.01 <0.01 B101 0.12 0.19 0.08 0.06 B B (other) <0.01 <0.01 <0.01 <0.01 O01 0.24 0.34 0.35 0.30 Surprisingly little allelic variation among CHN No A2 alleles Chip designs may be a factor O02 0.09 0.27 0.16 0.26 O O09 0.00 <0.01 0.02 0.12 0.26 0.01 O (other) <0.01 0.14 <0.01 0.18 <0.01 Unknown <0.01 ?
14 MESA ABO Type Distribution Summary ABO rates highly concordant with previously reported frequencies in similar populations Higher frequencies of Type-B in AFA (18.2%) and CHN (26.4%) HIS has highest Type-O rate (57.2%) ABO Typing Summary N (% of Total) AFA CHN 1617 (1.00) 751 (1.00) 1536 (0.95) 743 (0.99) 1517 (0.94) 743 (0.99) EUR HIS Total With Haps (PPr > 0.90) With ABO Type 2471 (1.00) 2437 (0.99) 2424 (0.98) 1416 (1.00) 1396 (0.99) 1393 (0.98)
15 ABO Associations with CVD in MESA For preliminary statistical analyses of ABO and CVD, we examined associations with three (3) separate phenotypes Log-transformed VWF Ankle Brachial Index (ABI) Also peripheral artery disease (PAD Yes/No) defined as ABI < 0.9 Incident Coronary Heart Disease (CHD) All models minimally adjusted (i.e., age and sex) Pooled analyses also adjusted for race Modeled ABO status three (3) separate ways: Blood type as a factor (O as reference) O vs. non-O blood types (i.e., dichotomous) ABO allele count as numeric vector: genotype (A,B) A B O 1 1 0
16 Results: ABO and VWF Log(VWF) was modeled using linear regression Sanity Check As expected, associations with ABO highly significant across all races Higher VWF for non-O Types Allele count analysis reveals A- and B-alleles may have different effects (except CHN?) AFA 0.18 0.01 0.35 1E-06 CHN 0.25 1E-04 0.25 3E-04 EUR 0.20 2E-13 0.35 2E-14 HIS 0.21 1E-07 0.34 5E-06 Allele ALL 0.21 <2E-16 0.34 <2E-16 ? P A ? P B
17 Distribution of VWF by ABO Type
18 Results: ABO and ABI/PAD ABI was modeled using linear regression Filtered out subjects with ABI > 1.4 PAD (ABI< 0.9 Affected) modeled using logistic regression Type-A significantly associated with lower ABI in AFA Additional analyses indicate additive effect of A allele Appears to be race-specific effect Similar results for Type-A and PAD AFA has lowest Type-A frequency and highest PAD frequency OR per copy of A allele: 1.80 (1.26,2.54); P = 0.00095
19 Results: ABO and CHD All Mesa Subjects No significant associations with CHD and ABO Type Either as factor or O vs. non-O Similar results when stratifying by gender Limited by lack of events Risk association with A- allele count in pooled analysis HR = 1.20 (1.02,1.40) P = 0.025
20 Conclusions and Future Work Successfully assigned ABO blood types to 94-99% of MESA cohort Identified large number of novel alleles (especially in AFA) Genetic diversity in AFA made haplotyping relatively more difficult More generic modeling of ABO could increase typing rate (178 w/o ABO) ABO association results for ABI and CHD indicate potential role of A- allele count Increased risk of CHD with A-allele carriers? Lower ABI, increased PAD risk in AFA with Type-A Multiple ways to model ABO blood type at finer granularity E.g., A1 vs. A2 alleles (role in CHN?) Effect modifications? Correlation with other risk factors? Manual curation of remaining haplotypes to determine ABO status 38 total subjects with PPr > 0.9 but unknown ABO status Likely A1 alleles
21 Acknowledgments CardioMetaboChip Collaborators MESA Adhesion Study Suzette J. Bielinski, PhD MESA Air Mariza de Andrade, PhD Joel D. Kaufman Paul A. Decker, MS Sverre Vedal Phil Kirsch, MPH MESA Genotype Hughes Sicotte, PhD Jerome I. Rotter Nicholas B. Larson, PhD Kent D. Taylor Cecilia Berardi, MD Yii-Der Ida Chen Michael Tsai, MD Xiuqing Guo Naomi Hanson, MS MESA CC Kayleen Williams James S. Pankow, PhD Weihong Tang, PhD Michele Sale, PhD Christina Wassel, PhD
22 ADDITIONAL SLIDES
23 Haplotype Estimation Methods EM MAXIMIZATION Estimate haplotype allele frequencies Subject ? Geno H1 H2 Frequency 1 2 1 1 0 1 1 0 0 0 0 1 1 1 0 H1 Iterate until convergence H2 H3 H4 Determine most likely haplotypes from genotypes EXPECTATION
24 Number of Estimated Haplotypes AFA had highest number of estimated haplotypes CHN lowest Number of Estimated Haplotypes AFA CHN 20 7 40 4 17 1 77 12 EUR 17 22 6 45 HIS 21 27 4 52 In BGMUT Novel A/B/O Unknown Total Although AFA had 17 unknown haplotypes (no ABO assignment), corresponding frequencies VERY low (<0.001)
25 Analysis Results VWF (by Type) Type-A Type-B Type-AB P P P Race ? (SE) ? (SE) ? (SE) AFA 0.335 (0.064) 5E-07 0.492 (0.066) 5E-12 0.404 (0.127) 0.002 CHN 0.364 (0.091) 1E-04 0.332 (0.085) 2E-04 0.491 (0.117) 6E-05 EUR 0.296 (0.035) 7E-16 0.392 (0.054) 2E-12 0.570 (0.081) 1E-11 HIS 0.316 (0.050) 1E-09 0.409 (0.085) 3E-06 0.543 (0.154) 5E-04 0.314 (0.025) 2E-16 0.417 (0.034) 2E-16 0.525 (0.055) 2E-16 ALL (ALL SIGNIFICANT)
26 Analysis Results ABI (by Type) Type-A Type-B Type-AB P P P Race ? (SE) ? (SE) ? (SE) AFA -0.008 (0.008) 0.35 -0.006 (0.014) 0.65 -0.027 (0.007) 3E-04 CHN -0.007 (0.008) 0.36 -0.004 (0.007) 0.58 0.006 (0.011) 0.63 EUR -0.004 (0.005) 0.39 0.002 (0.008) 0.84 -0.012 (0.011) 0.28 HIS -0.002 (0.006) 0.74 0.008 (0.009) 0.39 0.033 (0.017) 0.06 -0.005 (0.003) 0.09 -0.001 (0.004) 0.86 -0.007 (0.007) 0.25 ALL
27 Analysis Results PAD (by Type) Type-A Type-B Type-AB P P P Race OR (95% CI) OR (95% CI) OR (95% CI) AFA 0.66 (0.30,1.30) 0.25 1.47 (0.48,3.67) 0.45 2.06 (1.29,3.30) 3E-03 CHN 3.01 (0.57,22.2) 0.21 2.11 (0.10,23.1) 0.55 5.64 (1.31,38.8) 0.035 EUR 0.78 (0.47,1.28) 0.33 0.71 (0.26,1.59) 0.44 1.46 (0.49,3.54) 0.45 HIS 0.54 (0.18,1.35) 0.22 0 (NA,NA) 0.99 1.24 (0.65,7.08) 0.84 1.22 (0.90,1.66) 0.20 1.37 (0.69,2.48) 0.33 ALL 0.62 (0.37,1.00) 0.06
28 Analysis Results CHD (By Type) Type-A Type-B Type-AB P P P Race HR (95% CI) HR (95% CI) HR (95% CI) AFA 1.04 (0.57,1.87) 0.44 1.40 (0.59,3.26) 0.44 1.53 (0.96,2.47) 0.07 CHN 1.69 (0.80,3.56) 0.17 1.55 (0.71,3.39) 0.28 0.78 (0.17,3.46) 0.74 EUR 1.02 (0.76,1.37) 0.88 0.69 (0.40,1.19) 0.18 1.13 (0.57,2.25) 0.72 HIS 1.28 (0.83,1.95) 0.26 0.50 (0.20,1.26) 0.14 1.57 (0.49,5.02) 0.45 0.84 (0.61,1.16) 0.29 1.17 (0.73,1.85) 0.51 ALL 1.21 (0.98,1.49) 0.07
29 Analysis Results CHD (by Count) A-Allele B-Allele P P Race HR (95% CI) HR (95% CI) AFA 1.30 (0.91,1.84) 0.14 1.02 (0.66,1.57) 0.94 CHN 1.17 (0.70,1.95) 0.56 1.08 (0.60,1.93) 0.80 EUR 1.15 (0.93,1.43) 0.19 0.91 (0.62,1.35) 0.65 HIS 1.24 (0.87,1.77) 0.24 0.64 (0.32,1.29) 0.21 0.92 (0.72,1.17) 0.50 ALL 1.20 (1.02,1.40) 0.025