Accountability & Capacity in SA Education System
Background information on SA education system, learning trajectories & deficits, research on mathematics teachers, accountability, and capacity in South Africa. Discussing disparities in school resources and pressures, labor market types, and insurmountable learning deficits in Grades 3, 4, and 5 based on the NSES study.

Download Presentation

Please find below an Image/Link to download the presentation.
The content on the website is provided AS IS for your information and personal use only. It may not be sold, licensed, or shared on other websites without obtaining consent from the author. If you encounter any issues during the download, it is possible that the publisher has removed the file from their server.
You are allowed to download the files provided on this website for personal or commercial use, subject to the condition that they are used lawfully. All files are the property of their respective owners.
The content on the website is provided AS IS for your information and personal use only. It may not be sold, licensed, or shared on other websites without obtaining consent from the author.
E N D
Presentation Transcript
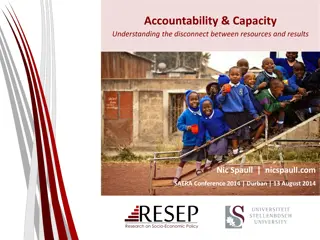
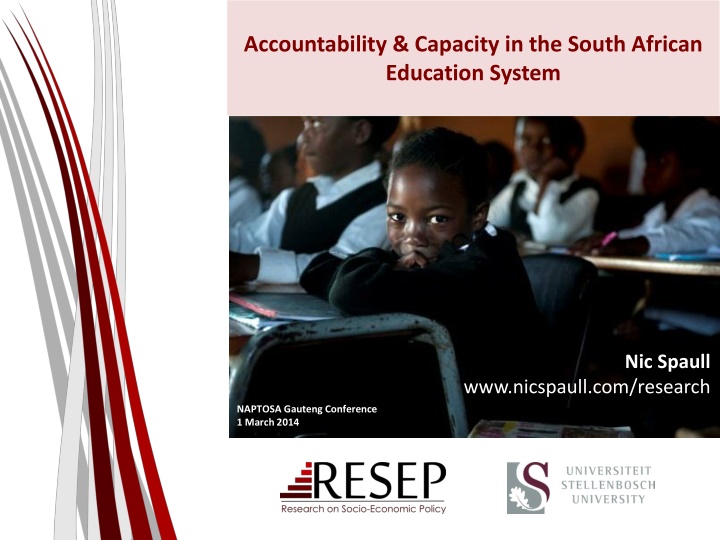
Accountability & Capacity in the South African Education System Nic Spaull www.nicspaull.com/research NAPTOSA Gauteng Conference 1 March 2014
Overview 1. Background information to SA education system 2. Learning trajectories & insurmountable learning deficits 3. New research on mathematics teacher content knowledge in South Africa 4. Accountability & Capacity in South Africa 2
Birds-eye view of the South African education system
Not all schools are born equal ? Pretoria Boys High School SA public schools? Different resources (Capacity) Different pressures (Accountability) 4
Labour Market Type University/ FET High productivity jobs and incomes (17%) Mainly professional, managerial & skilled jobs Requires graduates, good quality matric or good vocational skills Historically mainly white High quality secondary school High SES background +ECD Type of institution (FET or University) Quality of institution Type of qualification (diploma, degree etc.) Field of study (Engineering, Arts etc.) 17% High quality primary school Minority (20%) Unequal society Some motivated, lucky or talented students make the transition - Big demand for good schools despite fees Some scholarships/bursaries Majority (80%) Vocational training Affirmative action - Quality Semi- Skilled (31%) Low quality secondary school Low Low productivity jobs & incomes Often manual or low skill jobs Limited or low quality education Minimum wage can exceed productivity Socioeconomic status background Unskilled (19%) Low quality primary school Unemployed Attainment (Broad - 33%) 5 cf. Servaas van der Berg QLFS 2011
Insurmountable learning deficits How much learning takes place in classrooms in South Africa? (Grades 3, 4 & 5) 6
NSES question 37 NSES followed about 15000 students (266 schools) and tested them in Grade 3 (2007), Grade 4 (2008) and Grade 5 (2009). Grade 3 maths curriculum: Can perform calculations using approp symbols to solve problems involving: MULTIPLICATION of at least 2-digit by 1-digit numbers Even at the end of Grade 5 more than a third of quintile 1-4 students cannot answer this simple Grade-3-level problem. 100% 18% 90% 33% 37% 37% 38% 80% 11% 70% 17% 60% Still wrong in Gr5 18% The powerful notions of ratio, rate and proportion are built upon the simpler concepts of whole number, multiplication and division, fraction and rational number, themselves the precursors to the development of yet more complex concepts such as triangle similarity, trigonometry, gradient and calculus (Taylor & Reddi, 2013: 194) 17% 18% 17% 50% Correct in Gr5 40% 19% 18% Correct in Gr4 and are 20% 22% 30% 54% Correct in Gr3 20% 29% 29% 25% 23% 10% 0% Q1 Q2 Q3 Q4 Q5 Question 37 7
NSES question 42 NSES followed about 15000 students (266 schools) and tested them in Grade 3 (2007), Grade 4 (2008) and Grade 5 (2009). Grade 3 maths curriculum: Can perform calculations using appropriate symbols to solve problems involving: division of at least 2-digit by 1-digit numbers 100% Even at the end of Grade 5 most (55%+) quintile 1-4 students cannot answer this simple Grade-3-level problem. 90% 35% 80% 55% 57% 57% 59% 70% 60% 13% Still wrong in Gr5 The powerful notions of ratio, rate and proportion are built upon the simpler concepts of whole number, multiplication and division, fraction and rational number, themselves the precursors to the development of yet more complex concepts such as triangle similarity, trigonometry, gradient and calculus (Taylor & Reddi, 2013: 194) 50% Correct in Gr5 14% 40% 15% Correct in Gr4 14% 14% 13% and are 30% Correct in Gr3 10% 12% 12% 13% 20% 39% 10% 19% 17% 17% 16% 0% Q1 Q2 Q3 Q4 Q5 Question 42 8
Insurmountable learning deficits: 0.3 SD South African Learning Trajectories by National Socioeconomic Quintiles Based on NSES (2007/8/9) for grades 3, 4 and 5, SACMEQ (2007) for grade 6 and TIMSS (2011) for grade 9) 13 How does this affect matric? 12 11 10 9 8 Effective grade Quintile 1 7 Quintile 2 6 Quintile 3 Quintile 4 5 Quintile 5 4 Q1-4 Trajectory 3 Q5 Trajectory 2 1 0 Gr3 Gr4 Gr5 Gr6 Gr7 Gr8 Gr9 Gr10 Gr11 Gr12 (NSES 2007/8/9) (SACMEQ 2007) Projections (TIMSS 2011) Projections Actual grade (and data source) 9 (Spaull & Viljoen, Forthcoming)
Of 100 students that started school in 2002 16% Do not reach matric Fail matric 2013 49% Pass matric 2013 24% Pass with university endorsement 2013 11% 550,000 students drop out before matric 99% of those who don t get matric don t get a non-matric qualification (Gustafsson, 2011: p11) What happens to them? 50% youth unemployment. 10
Matric pass rate Media sees only this MATRIC What are the root causes of low and unequal achievement? Pre-MATRIC HUGE learning deficits 11
New research on mathematics teacher content knowledge in SA
What are the content knowledge (CK) levels of South African Gr6 Maths teachers? (SACMEQ 2007) 80% 70% 60% 50% 40% 62% 30% 20% 10% 17% 16% 5% 0% CK critically below level taught (pre Gr4) CK below level taught (Gr4/5) CK at level taught (Gr6/7) CK above level taught (Gr8/9) To be classified at a Grade-level, teachers must achieve at least 60% correct on grade-level items (adjusted for guessing) 13 (Venkatakrishnan & Spaull, Forthcoming)
What are the content knowledge (CK) levels of South African Gr6 Maths teachers? (SACMEQ 2007) [By school quintile] Quintile 1 Quintile 2 Quintile 3 Quintile 4 Quintile 5 90% 80% 70% 60% 50% 40% 71% 67% 64% 61% 30% 45% 45% 20% 25% 25% 10% 19% 16% 15% 8% 5% 6% 6% 2% 3% 5% 4% 6% 0% CK critically below level taught (pre Gr4) CK below level taught (Gr4/5) CK at level taught (Gr6/7) CK above level taught (Gr8/9) To be classified at a Grade-level, teachers must achieve at least 60% correct on grade-level items (adjusted for guessing) 14 (Venkatakrishnan & Spaull, Forthcoming)
Maths teacher content knowledge in SA Critically low levels of CK in SA Teachers cannot teach what they do not know Urgent need to provide teachers with meaningful learning opportunities (ala Shalem, 2003) How?! Not a single program proven to raise maths teacher CK at scale (proper evaluation) Q&A with Prof Muller Q: What do you think is the most under-researched area in SA education? A: We have no idea what it will take to make knowledgeable teachers out of clueless ones, at least not while they are actually on-the-job http://nicspaull.com/2014/02/28/qa-with-johan-muller/ 15
Solutions? Accountability & Capacity 16
Important distinctions Improved student outcomes Increased resources on-the- ground Increased allocation of resources (budget) Often these 3 are spoken about interchangeably 17
Important distinctions Improved student outcomes Increased resources on-the- ground Increased allocation of resources (budget) 18
Important distinctions Improved student outcomes Increased resources on-the- ground Increased allocation of resources (budget) 19
Important distinctions Improved student outcomes Increased resources on-the- ground Increased allocation of resources (budget) 20
Accountability without capacity Accountability systems and incentive structures, no matter how well designed, are only as effective as the capacity of the organization to respond. The purpose of an accountability system is to focus the resources and capacities of an organization towards a particular end. Accountability systems can t mobilize resources that schools don t have...the capacity to improve precedes and shapes schools responses to the external demands of accountability systems (Elmore, 2004b, p. 117). If policy-makers rely on incentives for improving either a school or a student, then the question arises, incentives to do what? What exactly should educators in failing schools do tomorrow - that they do not do today - to produce more learning? What should a failing student do tomorrow that he or she is not doing today? (Loveless, 2005, pp. 16, 26). 22
Capacity without accountability In the absence of accountability sub-systems, support measures are very much a hit and miss affair. Accountability measures provide motivation for and direction to support measures, by identifying capacity shortcomings, establishing outcome targets, and setting in place incentives and sanctions which motivate and constrain teachers and managers throughout the system to apply the lessons learned on training courses in their daily work practices. Without these, support measures are like trying to push a piece of string: with the best will in the world, it has nowhere to go. Conversely, the performance gains achieved by accountability measures, however efficiently implemented, will reach a ceiling when the lack of leadership and technical skills on the part of managers, and curricular knowledge on the part of teachers, places a limit on improved performance. Thus, the third step in improving the quality of schooling is to provide targeted training programs to managers and teachers. To achieve optimal effects, these will need to connect up with and be steered by accountability measures (Taylor, 2002, p. 17). 23
EG: Teacher training that doesn t change behavior [training on how to teach with a workbook but no incr in curric coverage because workbooks aren t monitored or outcomes (like reading) regularly assessed 25
EG: Imposing sanctions & rewards for doing things that teachers can t do [if a teacher isn t teaching fractions because she can t do fractions herself, no amount of pressure can force her to cover that topic] 26
Only when schools have both the incentive to respond to an accountability system as well as the capacity to do so will there be an improvement in student outcomes. (p22) 30
Take home points 1. SA s educational performance is extremely low and highly unequal 2. Decreasing inequality not possible without changing wages of majority which isn t possible without improving the quality of education 3. Very little learning taking place in many SA schools 4. SA children 3-4 yrs behind the curriculum. Acquire learning deficits early on and this handicaps them as they progress 5. Maths teacher CK is extremely low in large parts of the system What role for teacher testing & training? 6. Solutions: can t focus on eitheraccountability (pressure/incentives) orcapacity (resources/support), must focus on both 31
References & reading Spaull, N. 2014. Accountability in South African Education. Ch4 in Transformation Audit 2013: Confronting Exclusion Institute for Justice and Reconciliation. Cape Town. http://ijr.org.za/publications/pdfs/TA%202013%20text%20and%20cover%20web.pdf Spaull, N. 2013. South Africa s Education Crisis: The Quality of Education in South Africa 1995-2011. Centre for Development and Enterprise. http://www.cde.org.za/images/pdf/South%20Africas%20Education%20Crisis%20N%2 0Spaull%202013.pdf Elmore, R. (2004a). Agency, Reciprocity, and Accountability in Democratic Education. Cambridge, MA: Consortium for Policy Research in Education. Elmore, R. (2008). Leadership as the practice of improvement. In OECD, Improving School Leadership. Volume 2: Case Studies on System Leadership (pp. 37-67). Paris: OECD Publishing. 32
Thank you Comments & Questions? This presentation & others are available online at: www.nicspaull.com/research NicholasSpaull@gmail.com 33
Qualifications by age (birth cohort), 2011 (Van der Berg, 2013) 100% Degree Some tertiary 90% 80% Matric 70% 60% 50% Some secondary Primary completed 40% 30% Some primary 20% No schooling 10% 0% 65 (1946) 60 (1951) 80 (1931) 75 (1936) 70 (1941) 55 (1956) 50 (1961) 45 (1966) 40 (1971) 35 (1976) 30 (1981) 25 (1986) 20 (1991)
The left hand barrel has horizontal wooden slabs, while the right hand side barrel has vertical slabs. The volume in the first barrel depends on the sum of the width of all slabs. Increasing the width of any slab will increase the volume of the barrel. So a strategy on improving anything you can, when you can, while you can, would be effective. The volume in the second barrel is determined by the length of the shortest slab. Two implications of the second barrel are that the impact of a change in a slab on the volume of the barrel depends on whether it is the binding constraint or not. If not, the impact is zero. If it is the binding constraint, the impact will depend on the distance between the shortest slab and the next shortest slab (Hausmann, Klinger, & Wagner, 2008, p. 17). 39
Accountability stages... SA is a few decades behind many OECD countries. Predictable outcomes as we move from stage to stage. Loveless (2005: 7) explains the historical sequence of accountability movements for students similar movements for teachers? Stages in accountability movements: 1) Setting standards Stage 1 Setting standards (defining what students should learn), CAPS Stage 2 - Measuring achievement (testing to see what students have learned), ANA Stage 3 - Holding educators & students accountable (making results count). Western Cape performance agreements? 2) Measuring achievement 3) Holding accountable CAPACITY! For every increment of performance I demand from you, I have an equal responsibility to provide you with the capacity to meet that expectation. Likewise, for every investment you make in my skill and knowledge, I have a reciprocal responsibility to demonstrate some new increment in performance (Elmore, 2004b, p. 93). 40
South African teacher content knowledge
Teacher Content Knowledge Conference Board of the Mathematical Sciences (2001, ch.2) recommends that mathematics teachers need: A thorough mastery of the mathematics in several grades beyond that which they expect to teach, as well as of the mathematics in earlier grades (2001 report The Mathematical Education of Teachers ) Ball et al (2008, p. 409) Teachers who do not themselves know the subject well are not likely to have the knowledge they need to help students learn this content. At the same time just knowing a subject may well not be sufficient for teaching. Shulman (1986, p. 9) We expect that the subject matter content understanding of the teacher be at least equal to that of his or her lay colleague, the mere subject matter major 42
South Africa specifically Taylor & Vinjevold s (1999, p. 230) conclusion in their book Getting Learning Right is particularly explicit: The most definite point of convergence across the [President s Education Initiative] studies is the conclusion that teachers poor conceptual knowledge of the subjects they are teaching is a fundamental constraint on the quality of teaching and learning activities, and consequently on the quality of learning outcomes. 43
Teacher knowledge Teachers cannot teach what they do not know. CK How to do fractions Demonizing teachers is popular, but unhelpful PCK how to teach fractions For every increment of performance I demand from you, I have an equal responsibility to provide you with the capacity to meet that expectation. Likewise, for every investment you make in my skill and knowledge, I have a reciprocal responsibility to demonstrate some new increment in performance Student understands & can calculate fractions (Elmore, 2004b, p. 93).
Possible solution The DBE cannot afford to be idealistic in its implementation of teacher training and testing Aspirational planning approach: All primary school mathematics teachers should be able to pass the matric mathematics exam (benchmark = desirable teacher CK) Realistic approach: (e.g.) minimum proficiency benchmark where teachers have to achieve at least 90% in the ANA of the grades in which they teach, and 70% in Grade 9 ANA (benchmark = basic teacher CK) Pilot the system with one district. Imperative to evaluate which teacher training option (of hundreds) works best in urban/rural for example. Rigorous impact evaluations are needed before selecting a program and then rolling it out Tests are primarily for diagnostic purposes not punitive purposes 47
How have educational outcomes changed in Gauteng between 1995 and 2011?
Figure 1: Provincial scores for Grade 8 Mathematics, TIMSS 1995*, 1999, 2002 (with 95% confidence interval) 1995* Maths Gr8 1998 Maths Gr8 2002 Maths Gr8 500 450 400 350 TIMSS Maths score 300 250 200 150 100 50 0 LMP ECA NWP KZN MPU FST GAU NCA WCA NATIONAL 49
Figure 5: Provincial average for Grade 9 Mathematics, TIMSS 2002 and TIMSS 2011 (with 95% confidence interval) - TIMSS benchmark used here is the average TIMSS middle-income Grade 8 mathematics mean score 2002 Maths Gr9 2011 Maths Gr9 600 500 400 300 474 433 200 403 383 354 352 350 343 342 333 321 313 100 0 50


 levels of South")
 levels of South African")


, 2011 (Van der Berg,")


 conceptual framework")