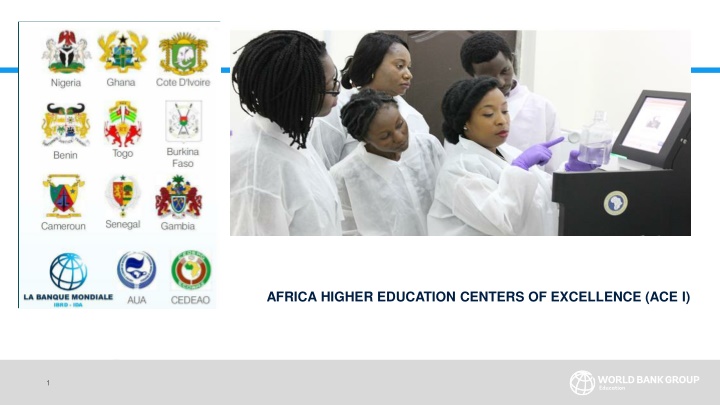
ACE.I Higher Education Centers of Excellence in Africa: Progress and Disbursement Data
"Explore the progress and disbursement details of ACE.I Higher Education Centers of Excellence in Africa through a comprehensive analysis of planned disbursements, implementation progress, and total funds earned. Get insights into project development objectives and indicators for achieving excellence in education. Stay updated on achievements and targets in enhancing educational programs and international accreditations."
Download Presentation

Please find below an Image/Link to download the presentation.
The content on the website is provided AS IS for your information and personal use only. It may not be sold, licensed, or shared on other websites without obtaining consent from the author. If you encounter any issues during the download, it is possible that the publisher has removed the file from their server.
You are allowed to download the files provided on this website for personal or commercial use, subject to the condition that they are used lawfully. All files are the property of their respective owners.
The content on the website is provided AS IS for your information and personal use only. It may not be sold, licensed, or shared on other websites without obtaining consent from the author.
E N D
Presentation Transcript
ACE Disbursement Planned disbursement (based on expected results) by June 30 ACE DISBURSEMENT BY COUNTRY 100% Disbursement Rate as of April 2018 90% Country Gambia Nigeria Senegal Burkina Faso Benin Cameroon Ghana Togo Cote d'Ivoire AAU project wise 80% 93% 57% 47% 75% 35% 31% 72% 40% 26% 91% 54% 95% 65% 52% 80% 45% 40% 75% 50% 35% 93% 60% 70% 60% 50% 40% 30% 20% 10% 0% May-15 Nov-15 May-16 Nov-16 May-17 Aug-17 Oct-17 Apr-18 Gambia Benin Cote d'Ivoire Nigeria Cameroon AAU Senegal Ghana project wise Burkina Faso Togo 2
ACE Implementation Progress 80% 70% 60% 50% 40% 30% 20% 10% 0% Results achieved Total funds used to date/ Total Grant (%) Resutls and Expenditure Average 3
TOTAL AMOUNT EARNED / TOTAL AMOUNT ALLOCATED 84% SDR EARNED PER DLR 2.8 1 Institutional Readiness 2.6 Research Publications 3.1 - 3.4 Fiduciary Management ment 4 Procure ACE 2.1 Short-term Students 2.2 Master Students 2.3 PhD tudents 2.5 2.7 External Revenue Teaching & Learning Environment 2.4 Internship Accreditation 2iE 5,200,000 100% 82% 323% 32% 47% 100% 100% 100% 50% 38% 13% ACEGID 5,100,000 100% 60% 18% 80% 11% 25% 100% 100% 50% 41% 25% 60% ACENTDFB 2,600,000 100% 47% 81% 100% 5% 50% 100% 0% 50% 50% 50% 52% ACEPRD 5,100,000 100% 31% 68% 115% 28% 25% 85% 0% 100% 25% 25% 57% CEADESE 5,100,000 100% 0% 40% 66% 11% 25% 100% 0% 50% 41% 25% 42% CEA-MITIC 5,200,000 100% 3% 100% 166% 17% 100% 100% 31% 25% 31% 13% 61% CEFTER 4,500,000 100% 47% 43% 31% 31% 26% 57% 25% 50% 50% 50% 43% CERHI 5,100,000 100% 131% 87% 32% 17% 25% 100% 10% 0% 47% 25% 42% CERSA 5,200,000 100% 17% 44% 77% 49% 88% 46% 9% 25% 50% 13% 45% CETIC 5,200,000 100% 2% 86% 36% 34% 100% 100% 0% 0% 31% 0% 41% DRYLAND AGRIC 4,500,000 100% 23% 50% 119% 19% 52% 93% 100% 50% 88% 50% 66% KNUST 5,200,000 100% 24% 58% 109% 15% 0% 87% 100% 50% 41% 25% 58% OAU-OAK PARK 4,500,000 100% 61% 57% 101% 14% 52% 21% 100% 50% 56% 50% 58% PAMI 5,100,000 100% 76% 15% 87% 5% 38% 100% 0% 25% 41% 25% 42% WACCBIP 5,200,000 100% 15% 47% 141% 2% 98% 100% 100% 75% 38% 13% 73% WACCI 5,200,000 100% 17% 19% 140% 5% 25% 89% 100% 25% 38% 13% 53% CEA-SAMEF 5,200,000 100% 23% 8% 146% 1% 0% 100% 0% 0% 38% 13% 32% CEA-SMA 5,300,000 100% 4% 133% 134% 10% 0% 82% 0% 50% 38% 13% 46% CEFOR 2,900,000 100% 65% 183% 100% 33% 65% 100% 100% 0% 69% 25% 90% CCBAD 4,500,000 100% 0% 35% 283% 1% 0% 100% 0% 20% 6% 0% 40% CEA-MEM 4,500,000 100% 2% 126% 3% 21% 0% 0% 0% 0% 6% 0% 19% ENSEA 2,700,000 100% 100% 14% 34% 172% 81% 0% 95% 70% 20% 0% 41% 0% 80% 0% 40% 0% 34% 6% 39% 0% 21% 4,875,0 00 27% 51% AVERAGE TOTAL MAX DLR 103100000 9,890,000 5,215,000 5,215,000 5,215,000 10,470,000 10,470,000 10,470,000 15,675,000 20,730,000 4,875,000 103,100,000 4
ACE I is on Track to Achieve ALL 5 Project Development Objective (PDO) Indicators Cumulative Results 2017 PAD Baseline PAD target Year 3 Status ACE PDO INDICATORS Project Development Objective Indicators No. of national and regional students (Msc, Phd and short term) No. of Regional students (Msc, Phd and short term) No. of internationally accredited education programs 1,580 9,500 15,657 Achieved 987 5,300 4,987 On track 3 10 12 Achieved No. of Students and faculty with at least 1 month internship in a company or a local institution relevant to their field Amount of externally generated revenue 35 new Master and Phd programs-e.g Master s in Seed Technology at WACCI-Ghana 1600 PhD students 6,800 Msc students 1,037 4,300 3,448 On track 976877 5,000,000 29,000,000 Achieved 5


