Achieving the Millennium Development Goals: The Contribution of Family Planning
The images and data presented discuss the importance of family planning in achieving the Millennium Development Goals, focusing on projected numbers of women of reproductive age, pregnancies, intended and unintended pregnancies, and the need for increased access to family planning services worldwide.

Download Presentation

Please find below an Image/Link to download the presentation.
The content on the website is provided AS IS for your information and personal use only. It may not be sold, licensed, or shared on other websites without obtaining consent from the author.If you encounter any issues during the download, it is possible that the publisher has removed the file from their server.
You are allowed to download the files provided on this website for personal or commercial use, subject to the condition that they are used lawfully. All files are the property of their respective owners.
The content on the website is provided AS IS for your information and personal use only. It may not be sold, licensed, or shared on other websites without obtaining consent from the author.
E N D
Presentation Transcript
Achieving the Millennium Development Goals The contribution of family planning
Achieving the Millennium Development Goals The contribution of family planning Scott Moreland, Constella Futures Sandra Talbird, University of North Carolina, Chapel Hill
The number of women of reproductive age is large and growing. Projected women of reproductive age in Mali Projected women of reproductive age in Nigeria 5,000,000 50,000,000 4,000,000 40,000,000 3,000,000 30,000,000 2,000,000 20,000,000 1,000,000 10,000,000 0 0 2003 2001 2002 2003 2004 2005 2006 2007 2008 2009 2010 2011 2012 2013 2014 2015 2004 2005 2006 2007 2008 2009 2010 2011 2012 2013 2014 2015 Source: SPECTRUM 2.38 Projections
The number of pregnancies will continue to increase each year. Pregnancies in Mali Pregnancies in Nigeria 1,400,000 12,000,000 1,200,000 10,000,000 1,000,000 8,000,000 800,000 6,000,000 600,000 4,000,000 400,000 2,000,000 200,000 0 0 2003 2001 2002 2003 2004 2005 2006 2007 2008 2009 2010 2011 2012 2013 2014 2015 2004 2005 2006 2007 2008 2009 2010 2011 2012 2013 2014 2015 Source: SPECTRUM 2.38 Projections
A significant percentage of these pregnancies are unintended or mistimed. Total pregnancies Nigeria 2003 Mali 2001 Mistimed 21% Mistimed 27% Unintended 10% Intended 62% Unintended 11% Intended 69% Source: SPECTRUM 2.38 Projections
Many women want to space or limit their births but do not use family planning. Number of women using or wanting to use family planning 7,000,000 6,000,000 5,000,000 3,499,636 4,000,000 3,000,000 1,115,071 2,000,000 2,609,196 630,729 625,558 1,000,000 718,331 826,465 179,260 0 Nigeria Madagascar Mali Ghana Users Unmet Need Source: DHS Users defined as married women of reproductive age (MWRA) currently using contraception Unmet need represents those who want to use family planning but are not currently doing so
Use of less effective, traditional contraceptive methods is high. Percentage distribution of users by type of family planning method used Traditional Modern Nigeria Mali 35% 30% 65% 70% Ghana Madagascar 26% 32% 74% 68% Source: DHS, married women (Nigeria 2003, Mali 2001, Ghana 2003, Madagascar 2003/2004)
Meeting the unmet need for family planning will increase the percentage of women using family planning. CPR in Nigeria CPR in Mali 40 35 35 30 30 25 25 20 20 % % 15 15 10 10 5 5 0 0 2003 2005 2007 2009 2011 2013 2015 2017 2019 2001 2003 2005 2007 2009 2011 2013 2015 2017 2019 Source: Nigeria DHS 2003, Mali DHS 2001, married women
The number of women using family planning will increase when unmet need is met. FP users in Mali FP users in Nigeria 2,000,000 12,000,000 1,500,000 9,000,000 1,000,000 6,000,000 500,000 3,000,000 0 0 2003 2005 2007 2009 2011 2013 2015 2017 2019 2001 2003 2005 2007 2009 2011 2013 2015 2017 2019 Need Met Base Need Met Base Source: SPECTRUM 2.38 Projections
Meeting the unmet need for family planning will reduce unintended pregnancies Unintended pregnancies in Nigeria Unintended pregnancies in Mali 3,500,000 500,000 3,000,000 400,000 2,500,000 300,000 2,000,000 1,500,000 200,000 1,000,000 100,000 500,000 0 0 2005 2007 2009 2011 2013 2015 2005 2007 2009 2011 2013 2015 Need Met Base Need Met Base Source: SPECTRUM 2.38 Projections
as well as reduce the number of abortions. Abortions in Nigeria Abortions in Mali 200,000 1,200,000 150,000 900,000 100,000 600,000 300,000 50,000 0 0 2005 2007 2009 2011 2013 2015 2005 2007 2009 2011 2013 2015 Need Met Base Need Met Base Source: Henshaw et al., 1999, and SPECTRUM 2.38 Projections
and therefore reduce the number of unintended births. Unintended births in Nigeria Unintended births in Mali 1,800,000 300,000 1,500,000 250,000 1,200,000 200,000 900,000 150,000 600,000 100,000 300,000 50,000 0 0 2005 2007 2009 2011 2013 2015 2005 2007 2009 2011 2013 2015 Need Met Base Need Met Base Source: Calculated by authors based on unintended pregnancies, abortions, and spontaneous abortions
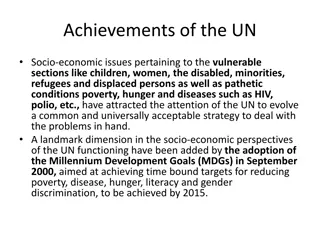
1. Eradicate extreme poverty and hunger 2. Achieve universal primary education 3. Promote gender equality and empower women 4. Reduce child mortality 5. Improve maternal health 6. Combat HIV/AIDS, malaria and other diseases 7. Ensure environmental sustainability 8. Develop a global partnership for development
Reducing unmet need for family planning can help countries to meet the MDGs by reducing the cost of achieving the goals. Liz Gilbert, the David & Lucile Packard Foundation Chamberlain Diala, JHU/CCP Chamberlain Diala, JHU/CCP
Focus on 5 Millennium Development Goals Achieve universal primary education Reduce child mortality Improve maternal health Combat HIV/AIDS, malaria and other diseases Ensure environmental sustainability
Calculating savings in the costs of meeting the MDGs due to increased contraceptive use 1. Project the population with constant FP use and with unmet need fulfilled 2. Calculate the costs of meeting the MDGs for each projection 3. Compare the cost projections and calculate the difference
Contraceptive prevalence rate assumptions used to calculate population scenarios CPR + Unmet Need 42.6 46.2 13.8 43.3 59.2 30.4 63.8 50.7 36.6 24.8 29.5 25.1 47.7 47.2 57.4 61.6 Annual % Increase 2015 2.4 1.8 0.5 2.9 2.8 1.5 2.0 2.0 2.0 1.0 1.4 1.5 1.9 1.4 2.3 2.0 Annual % Increase 2020 1.7 1.3 0.4 1.9 2.0 1.2 1.4 1.4 1.5 0.8 1.0 1.0 1.5 1.0 1.7 1.4 Current CPR 13.8 26.0 4.1 14.7 25.2 6.2 39.3 27.1 8.1 8.2 12.6 7.4 12.9 25.4 22.8 34.2 Burkina Faso 2003 Cameroon 2004 Chad 1996/97 Ethiopia 2005 Ghana 2003 Guinea 1999 Kenya 2003 Madagascar 2003/2004 Mali 2001 Niger 1998 Nigeria 2003 Rwanda 2000* Senegal 1997 Tanzania 1999 Uganda 2000/01 Zambia 2001/02 Source: MEASURE DHS, Stat Compiler * Represents all women, not only married women
Unit costs applied to population projections for each of the MDGs Sector Parameter Unit Cost (US$) Family Planning Cost per couple-year of protection Cost per pupil $11.2 Education $30-$75 Immunization Cost per fully immunized child Cost per birth $17.0 Maternal Health $28.2-$37.3 Water/Sanitation Cost per beneficiary $4.6 Malaria - ITN Cost per treated-net- year $4.4
Achieve universal primary education Ensure that by 2015, children everywhere, boys and girls alike, will be able to complete the course of primary schooling.
Millennium Development Goals and Targets Primary education net enrollment rate 100% 80% 60% 40% 20% 0% Mali Guinea Kenya Ghana Tanzania Chad Rwanda Uganda Senegal Zambia Niger Nigeria Madagascar Ethiopia Cameroon Burkina Faso Current MDG Source: United Nations Statistics Division, 2000
Family planning use reduces the number of school-aged children. Annual number of children to be enrolled in primary education to meet the MDG in Ghana (2005-2015) Annual number of children to be enrolled in primary education to meet the MDG in Mali (2005-2015) # children 6-11 years old # children 6-11 years old 4,500,000 3,500,000 4,000,000 3,000,000 3,500,000 3,000,000 2,500,000 2,500,000 2,000,000 2,000,000 1,500,000 1,500,000 1,000,000 1,000,000 2005 2006 2007 2008 2009 2010 2011 2012 2013 2014 2015 2005 2006 2007 2008 2009 Base 2010 2011 Need Met 2012 2013 2014 2015 Base Need Met
which reduces the costs of meeting the primary education MDG. Cumulative primary education cost savings in Ghana Cumulative primary education cost savings in Mali $50 $35.8m $50 $37.8m $40 $40 Millions $30 Millions $30 $20 $20 $10 $10 $0 $0 2005 2006 2007 2008 2009 2010 2011 2012 2013 2014 2015 2005 2006 2007 2008 2009 2010 2011 2012 2013 2014 2015 Note: Costs discounted by 3 percent
Reduce child mortality Reduce by two thirds, between 1990 and 2015, the under-five mortality rate.
Millennium Development Goals and Targets Percentage of children under 1 vaccinated for measles 100% 80% 60% 40% 20% 0% Ghana Guinea Rwanda Niger Mali Chad Kenya Uganda Tanzania Zambia Senegal Cameroon Nigeria Madagascar Ethiopia Burkina Faso Current MDG Source: United Nations Statistics Division, 2000
Fulfilling unmet need reduces the number of children needing vaccinations. Annual number of children needing the measles vaccine to meet the MDG in Nigeria (2005-2015) Annual number of children needing the measles vaccine to meet the MDG in Madagascar (2005-2015) # children under 1 years old # children under 1 years old 7,000,000 1,000,000 6,000,000 800,000 5,000,000 4,000,000 600,000 3,000,000 400,000 2,000,000 200,000 1,000,000 0 0 2005 2006 2007 2008 2009 2010 2011 2012 2013 2014 2015 2005 2006 2007 2008 2009 2010 2011 2012 2013 2014 2015 Base Need Met Base Need Met
Fulfilling unmet need generates cost savings by reducing the costs of meeting the immunization target. Cumulative measles vaccination cost savings in Nigeria Cumulative measles vaccination cost savings in Madagascar $60,000,000 $52 m $13 m $15,000,000 $12,000,000 $45,000,000 $9,000,000 $30,000,000 $6,000,000 $15,000,000 $3,000,000 $0 $0 2005 2006 2007 2008 2009 2010 2011 2012 2013 2014 2015 2005 2006 2007 2008 2009 2010 2011 2012 2013 2014 2015 Note: Costs discounted by 3 percent
Fulfilling unmet need reduces the number of child deaths by reducing the number of high- risk births. Cumulative child deaths averted due to spacing and limiting births (2005-2015) 1,200,000 1,080,156 1,000,000 Deaths averted 800,000 600,000 284,576 400,000 199,952 185,960 200,000 0 Ghana Madagascar Mali Nigeria Source: Child Survival Model, John Stover, Futures Group
Improve maternal mortality Reduce by three-quarters, between 1990 and 2015, the maternal mortality ratio.
Millennium Development Goals and Targets Maternal mortality ratio (MMR) 1600 1400 Deaths per 100,000 live births 1200 1000 800 600 400 200 0 Ghana Guinea Rwanda Niger Mali Chad Kenya Uganda Tanzania Zambia Senegal Nigeria Cameroon Madagascar Ethiopia Burkina Faso MDG Current Source: United Nations Statistics Division, 2000
Fulfilling unmet need can reduce the number of births over the next 10 years. Annual number of births in Nigeria (2005-2015) Annual number of births in Ghana (2005-2015) 8,000,000 1,000,000 6,000,000 800,000 Births Births 600,000 4,000,000 400,000 2,000,000 200,000 0 0 2005 2006 2007 2008 2009 2010 2011 2012 2013 2014 2015 2005 2006 2007 2008 2009 2010 2011 2012 2013 2014 2015 Base Need Met Base Need Met
Reducing the number of births generates savings for maternal health costs. Cumulative maternal healthcare savings in Nigeria Cumulative maternal healthcare savings in Ghana $39 m $127 m $150,000,000 $40,000,000 $120,000,000 $30,000,000 $90,000,000 $20,000,000 $60,000,000 $10,000,000 $30,000,000 $0 $0 2005 2006 2007 2008 2009 2010 2011 2012 2013 2014 2015 2005 2006 2007 2008 2009 2010 2011 2012 2013 2014 2015 Note: Costs discounted by 3 percent
Fulfilling unmet need saves lives by reducing the number of maternal deaths. Maternal deaths averted by reducing the number of pregnancies (2000-2015) Burkina 4,962 1,954 Cameroon Chad 1,151 Ethiopia 12,782 Ghana 3,962 Guinea 1,987 Kenya 14,040 Madagascar 2,918 Mali 6,512 Niger 6,821 Nigeria 18,849 Rwanda 2,120 Senegal 4,007 Tanzania 18,688 Uganda 16,877 Zambia 4,474 0 2,000 4,000 6,000 8,000 10,000 12,000 14,000 16,000 18,000 20,000
Ensure environmental sustainability By 2015, reduce by half the proportion of people without sustainable access to safe drinking water and sanitation.
Millennium Development Goals and Targets Percentage of population without access to safe water and sanitation 100 80 % of population 60 40 20 0 Ghana Guinea Rwanda Niger Mali Chad Kenya Uganda Tanzania Zambia Senegal Nigeria Cameroon Madagascar Ethiopia Burkina Faso MDG Current Source: United Nations Statistics Division, 2000
Fulfilling unmet need reduces the number of people needing safe water and sanitation. Annual # of new people with access to safe water and sanitation in Nigeria (2005-2015) Annual # of new people with access to safe water and sanitation in Ghana (2005-2015) 1,000,000 8,000,000 7,000,000 800,000 6,000,000 600,000 5,000,000 400,000 4,000,000 3,000,000 200,000 2,000,000 0 1,000,000 2005 2006 2007 2008 2009 2010 2011 2012 2013 2014 2015 2005 2006 2007 2008 2009 2010 2011 2012 2013 2014 2015 Base Need met Base Need met
The costs of achieving the safe water and sanitation goals are reduced by fulfilling unmet need. Cumulative cost savings to provide water and sanitation in Ghana Cumulative cost savings to provide water and sanitation in Nigeria $25,000,000 $60,000,000 $54 m $21 m $50,000,000 $20,000,000 $40,000,000 $15,000,000 $30,000,000 $10,000,000 $20,000,000 $5,000,000 $10,000,000 $0 $0 2005 2006 2007 2008 2009 2010 2011 2012 2013 2014 2015 2005 2006 2007 2008 2009 2010 2011 2012 2013 2014 2015 Note: Costs discounted by 3 percent
Combat HIV/AIDS, malaria and other diseases By 2015, halt and begin to reverse the incidence of malaria and other major diseases
Millennium Development Goals and Targets Percentage of children under 5 with an insecticide-treated net 80 60 40 20 0 Mali Kenya Ghana Guinea Tanzania Chad Rwanda Uganda Senegal Niger Zambia Nigeria Madagascar Ethiopia Cameroon Burkina Faso Current MDG Source: United Nations Statistics Division, 2000
Fulfilling unmet need reduces the number of mosquito nets needed to reach the Abuja target of 60% coverage. Annual number of children under age 5 needing ITNs in Nigeria (2005-2015) Annual number of children under age 5 needing ITNs in Ghana (2005-2015) 3,000,000 20,000,000 2,500,000 15,000,000 2,000,000 1,500,000 10,000,000 1,000,000 5,000,000 500,000 0 0 2005 2006 2007 2008 2009 2010 2011 2012 2013 2014 2015 2005 2006 2007 2008 2009 2010 2011 2012 2013 2014 2015 Base Unmet Need Base Unmet Need
Reducing the number of mosquito nets needed makes reaching the Abuja target more affordable. Cumulative savings for reaching the ITN coverage goal in Nigeria $14,000,000 Cumulative savings for reaching the ITN coverage goal in Ghana $12.7m $12,000,000 $5,000,000 $4.2m $10,000,000 Metric Tons $4,000,000 Metric Tons $8,000,000 $3,000,000 $6,000,000 $2,000,000 $4,000,000 $1,000,000 $2,000,000 $0 $0 2005 2006 2007 2008 2009 2010 2011 2012 2013 2014 2015 2005 2006 2007 2008 2009 2010 2011 2012 2013 2014 2015 Note: Costs discounted by 3 percent
Weighing the Benefits and Costs of Meeting the MDGs by Fulfilling Unmet Need for Family Planning
The costs savings for the MDGs outweigh the costs of reducing unmet need. FP Costs (Millions) MDG Savings B/C Ratio FP Costs (Millions) MDG Savings B/C Ratio Burkina Faso $27.5 $80.9 2.95 Mali $35.8 $106.4 2.97 Cameroon $14.7 $54.9 3.72 Niger $28.6 $91.9 3.22 Chad $4.7 $25.0 5.29 Nigeria $139.5 $386.6 2.77 Ethiopia $102.8 $208.5 2.03 Rwanda $6.1 $28.2 4.59 Ghana $54.0 $120.6 2.23 Senegal $42.7 $265.6 6.22 Guinea $20.8 $80.0 3.85 Tanzania $71.6 $291.3 4.07 Kenya $71.4 $270.6 3.79 Uganda $97.4 $407.9 4.19 Madagascar $25.5 $76.4 3.00 Zambia $27.2 $111.3 4.09
Fulfilling unmet need leads to health benefits as well as cost savings. Maternal Deaths Averted Child Deaths Averted Abortions Averted Maternal Deaths Averted Child Deaths Averted Abortions Averted Burkina Faso 4,962 240,753 199,603 Mali 6,512 284,576 371,372 Cameroon 1,954 96,357 N/A Niger 6,821 280,203 652,384 Chad 1,151 56,857 151,557 Nigeria 18,849 1,080,156 1,207,568 Ethiopia 12,782 1,144,767 1,953,170 Rwanda 2,120 72,751 38,554 Ghana 3,962 199,952 430,739 Senegal 4,007 213,277 406,135 Guinea 1,987 119,227 212,698 Tanzania 18,688 495,786 1,065,044 Kenya 14,040 434,306 1,242,254 Uganda 16,877 796,296 1,176,963 Madagascar 2,918 185,960 391,037 Zambia 4,474 244,241 397,982
In Conclusion Achieving the MDGs will be a major challenge. These goals will be easier and cheaper to achieve if contraceptive use increases as a result of fulfilling unmet need. The additional costs of reducing unmet need for family planning are offset by substantial MDG cost savings by 2015.
Meeting the unmet need for family planning in Africa can help countries reach the MDGs.