Adapting to the Climate Emergency: Role of Developers in the Development Industry
Analysis of the residential development activity in Ontario since 1990, focusing on the significant contribution of Toronto in construction. The presentation delves into the impact of developers on the climate emergency, highlighting the importance of sustainable practices. The timeline showcases the evolution towards net-zero designs and climate action plans in apartment buildings.

Download Presentation

Please find below an Image/Link to download the presentation.
The content on the website is provided AS IS for your information and personal use only. It may not be sold, licensed, or shared on other websites without obtaining consent from the author.If you encounter any issues during the download, it is possible that the publisher has removed the file from their server.
You are allowed to download the files provided on this website for personal or commercial use, subject to the condition that they are used lawfully. All files are the property of their respective owners.
The content on the website is provided AS IS for your information and personal use only. It may not be sold, licensed, or shared on other websites without obtaining consent from the author.
E N D
Presentation Transcript
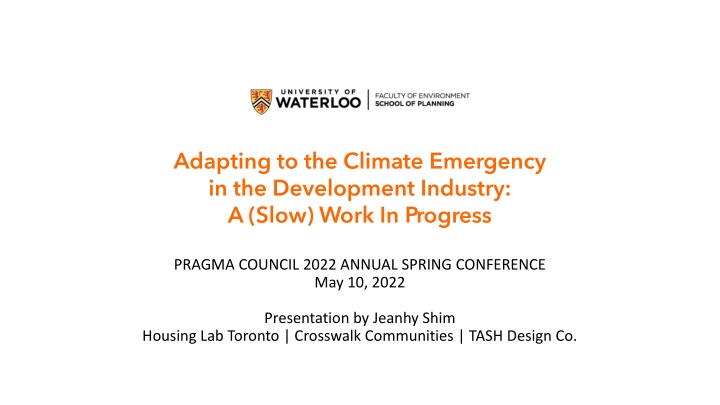
Adapting to the Climate Emergency in the Development Industry: A (Slow) Work In Progress PRAGMA COUNCIL 2022 ANNUAL SPRING CONFERENCE May 10, 2022 Presentation by Jeanhy Shim Housing Lab Toronto | Crosswalk Communities | TASH Design Co.
What do developers have to do with the climate emergency? 60% from residential buildings & homes 40% from commercial & institutional buildings Source: TransformTO City of Toronto 2019 Greenhouse Gas Emissions Inventory
Residential Development Activity in Ontario since 1990 Toronto CMA accounted for: 53% of total residential construction (1,096,164 homes) 71% of total apartment construction (499,891 homes) Apartments 706,239** 34% 44% of total low-rise construction (596,273 homes) Apartment dwellings are increasing: Total: 2,075,036 24% of new home completions from 1990 to 1999 22% of new home completions from 2000 to 2009 Low-rise 1,368,797* 66% 42% of new home completions from 2010 to 2019 50% of new home completions from 2020 to Q1-2022 74% of new homes under construction at end Q1-2022 * Includes 37,027 low-rise homes under construction in Q1-22 ** includes 108,016 apartments under construction in Q1-22 Source: CMHC, Statistics Canada
Development Impact Timeline Apartment Buildings in Toronto 2025 TGS v5 T1++ (m) T2++ (m) ZEBF 2017 Trans- formTO Climate Action Plan 2018 TGS v3 T1++ (m) T2++ (v+) ZEBF*** 2021 Net Zero by 2020 Climate Strategy 2022 TGS v4 T1++ (m) T2++ (m-) ZEBF 2028 TGS v5 Net-Zero Designs 2014 TGS v2 T1+ (m) T2+ (v+) 2010 TGS v1 T1 (m) T2 (v) 2006 TGS** (v) 1991 TAF* 2005 TAF Act Adaptation v2 (checklist) Adaptation v2+ (commitment) Leaders (ESG) Success? Adaptation v1 (checklist) Adaptation v1+ (commitment) Leaders (ESG) Compliance (checklist) Compliance + (commitment) Leaders (CSR) Resistance $ Reluctance $ (low hanging fruit) Early Adopters: (marketing edge, branding, CSR) Tridel Minto Blissful Ignorance > Winner of Inaugural BILD Green Home Builder Award 2007 * Toronto Atmospheric Fund ** Toronto Green Standards *** Zero Emissions Building Framework
Toronto Green Standard v4 (effective May 1, 2022) Building Energy, Emissions & Resilience Operational emissions reductions (Tier 1 only) Embodied emissions in materials Operational energy & emissions (Tier 1 only) Operational systems verification Water Quality & Efficiency Managing stormwater Water efficiency Ecology & Biodiversity Tree canopy Landscape & biodiversity Natural heritage protection Climate positive landscapes Bird collision deterrence Waste & The Circular Economy Waste collection & storage Building material re-use Sourcing of raw materials Construction waste management Air Quality Cycling infrastructure Pedestrian infrastructure
Current State of the Union Patchwork of Funding Mechanisms Patchwork of Measurements and Metrics Patchwork of Compliance and Reporting Standards Patchwork of Policies across municipalities
Are we on the right path? Source: Builders for Climate Action: Low-Rise Buildings as a Climate Change Solution, 2019
A new metric Carbon Use Intensity (CUI)? Key Findings: Available, affordable material options can reduce net up-front carbon Material selection is the most impactful intervention at the individual building level Fuel switching to clean, renewable electricity provides the largest overall emission reductions Energy efficiency beyond current code minimum in Ontario is the least effective and most costly means of reducing building emissions Feasible, affordable material options can be used to achieve net carbon storage in buildings Source: Builders for Climate Action: Low-Rise Buildings as a Climate Change Solution, 2019
Looking Forward We need more: 1. Policy the optimal way to compel change in a timely manner 2. Education 3. Supply chain capability & resources 4. Operations & execution training, maintenance 5. Measuring learning, improving 6. Functionality build human spaces in a climate responsible way
The undiscovered opportunity for affordable housing Can truly net-zero carbon building construction make affordable rental housing more financially feasible to build? Reduces building operating costs Reduces long term building maintenance & repair costs Reduces utility costs for tenants


")


?")