Addressing Childhood Obesity: A Primary Care Approach
Learn about the prevalence and impact of childhood obesity, strategies for prevention and management, barriers to treatment, and the long-term health consequences. Discover the financial burden, disparities, and physical/psychological health impacts associated with childhood obesity.
Download Presentation

Please find below an Image/Link to download the presentation.
The content on the website is provided AS IS for your information and personal use only. It may not be sold, licensed, or shared on other websites without obtaining consent from the author. If you encounter any issues during the download, it is possible that the publisher has removed the file from their server.
You are allowed to download the files provided on this website for personal or commercial use, subject to the condition that they are used lawfully. All files are the property of their respective owners.
The content on the website is provided AS IS for your information and personal use only. It may not be sold, licensed, or shared on other websites without obtaining consent from the author.
E N D
Presentation Transcript
COMBATTING CHILDHOOD OBESITY: A PRIMARY CARE APPROACH Uyen Le-Jenkins, DNP, CPNP-AC/PC Hampton Roads Annual NAPNAP 2013 Conference
DISCLOSURES I do not have any financial disclosures; neither do I intend to discuss off-label use of medications.
LEARNING OBJECTIVES Prevalence, trends and impact of childhood obesity Prevention, identification, management of childhood obesity Identify barriers to evaluation and treatment of childhood obesity
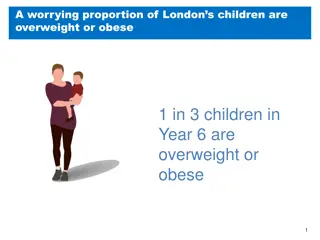
PREVALENCE Rate of obesity has tripled among children and adolescents in the past 30 years One third (12.5 million) of American children and adolescents ages 2-19 are considered obese Overweight and obese children are at an increased risk for acute and chronic comorbidities, including psychological impacts that can exact short and long term health consequences Public Health Threat: American children likely facing shorter life span than their parents!
DO OBESE CHILDREN BECOME OBESE ADULTS?
DISPARITIES Adult women more obese than adult men Male obesity rates are growing faster than female Obesity more common in poor, less educated, minority
COST OF OBESITY Childhood obesity is estimated to cost $14 billion annually in direct health expenses The hospital cost of pediatric obesity is also increasing 1979: $35 million 1999: $127 million 2005: $237million 2009 Center for Disease Control and Prevention Cost of Obesity = $147 BILLION annually
PHYSICAL AND PSYCHOLOGICAL HEALTH IMPACTS Short Term Joint pain, sleep disturbance, low self-esteem, poor body image School Related School absences, ADHD, fatigue, teasing, bullying, mood/adjustment disorder Long Term Diabetes, insulin resistance, OSA, menstrual irregularities, HTN, abnormal lipids, fatty liver disease
ETIOLOGY OF OBESITY Growing prevalence of obesity cannot be isolated to a single cause, but is attributable to numerous elements (complex social, behavioral, cultural, environmental, physiological, and genetic factors) Obesity epidemic stems from both dietary choices and sedentary lifestyle
CONTRIBUTING FACTORS Societal changes Access Built environments Schools Mass media Screen time Advertisements Soda
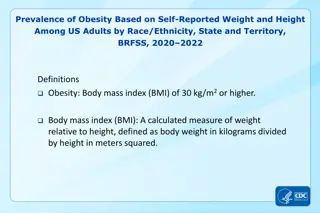
BMI The body mass index (BMI) is the accepted standard measure of overweight and obesity for children two two years of age and older. Body mass index provides a guideline for weight in relation to height and is equal to the body weight divided by the height squared
DEFINING THE PROBLEM Adult BMI between 25 and 30 = overweight Adult BMI 30 = obese Unlike adults, children grow in height as well as weight. Thus, the norms for BMI in children vary with age and sex
CDC DEFINES OVERWEIGHT/OBESE Ages 2 to 18 use BMI percentile (age/gender) Underweight: < 5th percentile Normal weight: 5th to < 85th percentile Overweight: 85th to < 95th percentile Obese: > 95th percentile Severe Obese: 99th percentile Ages 0 to 2 use height vs. weight Overweight: > 95th percentile
PATIENT BARRIERS Money Mind Mechanical Metabolic
PROVIDER BARRIERS Primary care providers are not routinely screening their patients for overweight and obesity utilizing BMI Provider skepticism Limited office time Minimal or no insurance reimbursement Unwillingness to change office procedures Not feeling equipped to manage these patients
EXPERT COMMITTEE RECOMMENDATION AAP 2007 Produced Obesity Recommendations and Obesity Tool kit
TREATMENT Stage A: Prevention for ALL! Stage 1: Prevention Plus (85-94%, healthy with risk factors) Stage 2: Structured Weight Management (95% or greater, prevention plus with comorbidities) Stage 3: Comprehensive Multidisciplinary Intervention Stage 4: Tertiary Care Intervention
PREVENTION FOR ALL Routine documentation of BMI Talk to patients and their families Identify those at risk for comorbidities (fasting labs) Anticipatory guidance/counseling Nutrition Physical activity Healthy lifestyles Praise for current healthy practices
MOTIVATIONAL INTERVIEWING: PRINCIPLES Resist arguing, persuasion, confrontation Understand motivation Listen to the family Empower the patient and affirm attempts to change
APPROACH Ask Ask permission to discuss weight, lifestyle Advise Advise about risks, benefits, improvements Assess Assess readiness for change, barriers Assist Assist with and a agree gree on plan, goals Arrange Arrange follow up No blame! No shame! Just educate, motivate and support!
TOPICS TO DISCUSS Breakfast Family meals Portion sizes Fast foods Fruit and Vegetable intake Screen time Active play Drinks
5-2-1-0 BEHAVIORAL TARGETS 5 servings of fruits and vegetables daily 2 hours or less of screen time: TV, computer, video games 1 hour physical activity (sweating!) 0 or almost 0 drinks containing sugar
5 things There are 5 things to remember under 5
NONE for those under 2 MAX of 2 hours for all others No televisions in children s bedrooms Effects both sides of calorie equation
60 minutes of activity per day 30 minutes of vigorous activity
Watch the label - <10 calories/serving Beware of fruit and sports drinks Limit fruit juice Only 100% 4-6 ounces per day ages 1-6 8-12 ounces per day ages 7- 18 No juice for infants <6 months Drink water and low fat milk
RESOURCES American Academy of Pediatrics: www.aap.org/obesity 2000 CDC Growth Charts: www.cdc.gov/growthcharts 5210 Let s Go: http://www.letsgo.org Bright Futures in Practice: www.brightfutures.aap.org National Initiatives for Children s Healthcare: http://www.nichq.org Let s Move: www.letsmove.gov Choose My Plate: http://myplate.gov
CONCLUSION: TREATMENT IS AVAILABLE, PREVENTION IS PREFERABLE!


