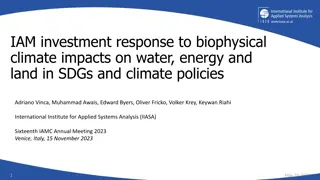
Addressing Climate and Biodiversity Crisis Through Collaboration
Explore the alarming statistics and actions needed to combat the climate and biodiversity crisis. Learn about the threats to freshwater and wetland species, projected population increases, and the importance of reducing greenhouse gas emissions. Discover how working together and planning for future climate scenarios can help restore vital habitats and create a more sustainable future.

Download Presentation

Please find below an Image/Link to download the presentation.
The content on the website is provided AS IS for your information and personal use only. It may not be sold, licensed, or shared on other websites without obtaining consent from the author. If you encounter any issues during the download, it is possible that the publisher has removed the file from their server.
You are allowed to download the files provided on this website for personal or commercial use, subject to the condition that they are used lawfully. All files are the property of their respective owners.
The content on the website is provided AS IS for your information and personal use only. It may not be sold, licensed, or shared on other websites without obtaining consent from the author.
E N D
Presentation Transcript
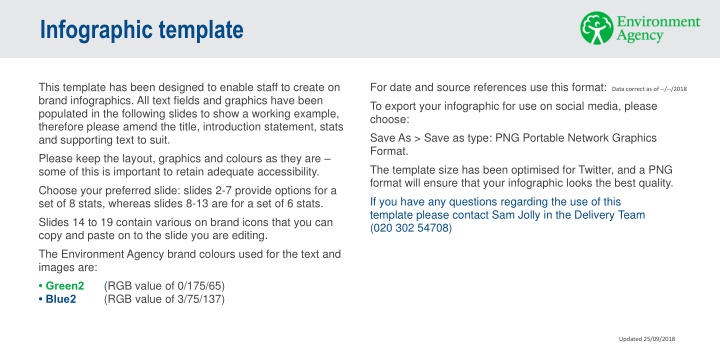
Infographic template This template has been designed to enable staff to create on brand infographics. All text fields and graphics have been populated in the following slides to show a working example, therefore please amend the title, introduction statement, stats and supporting text to suit. Please keep the layout, graphics and colours as they are some of this is important to retain adequate accessibility. Choose your preferred slide: slides 2-7 provide options for a set of 8 stats, whereas slides 8-13 are for a set of 6 stats. Slides 14 to 19 contain various on brand icons that you can copy and paste on to the slide you are editing. The Environment Agency brand colours used for the text and images are: Green2 (RGB value of 0/175/65) Blue2 (RGB value of 3/75/137) For date and source references use this format: To export your infographic for use on social media, please choose: Save As > Save as type: PNG Portable Network Graphics Format. The template size has been optimised for Twitter, and a PNG format will ensure that your infographic looks the best quality. If you have any questions regarding the use of this template please contact Sam Jolly in the Delivery Team (020 302 54708) Data correct as of --/--/2018 Updated 25/09/2018
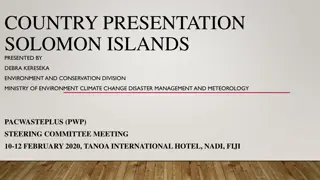
Climate and biodiversity crisis Over 10% 12% 12% Whats the problem ? of our freshwater and wetland species are threatened with extinction and two- thirds are in decline the projected increase in population of England from 55.3 million in 2016 to 62 million in 2041 Net zero 1,200 hectares hectares 1,200 Whats being done we all have our part to play in helping to reduce greenhouse gas emissions to net zero by 2050 of internationally protected inter-tidal habitat and a further 500 hectares of freshwater habitat will be lost due to coastal squeeze over the next 5 to 10 years Creating more wetland Creating more wetland habitat habitat 4oC What can be done? work together to plan for a range of future climate scenarios, including a 4 C rise by end of century the government is committed to restoring or creating more wetland and water features as part of a Nature Recovery Network, with 500,000ha of new or restored wildlife rich habitat at its heart
Climate and biodiversity crisis Over 10% 12% Graphic shows the projected 12% increase in population in Engalnd from 55.3 million in 2016 to 62 million in 2041. Graphic also shows that over 10% of our freshwater and wetland species are threatened with extinction and two-thirds are in decline of our freshwater and wetland species are threatened with extinction and two-thirds are in decline the projected increase in population of England from 55.3 million in 2016 to 62 million in 2041 1,200 hectares 1,200 hectares Graphic shows that we all have our part to play in helping to reduce greenhouse gas emissions to net zero by 2050 and that over 1200 hectares of internationally protected inter-tidal habitat and a further 500 hectares of freshwater habitat will be lost due to coastal squeeze over the next 5 to 10 years Net zero of internationally protected inter-tidal habitat and a further 500 hectares of freshwater habitat will be lost due to coastal squeeze over the next 5 to 10 years we all have our part to play in helping to reduce greenhouse gas emissions to net zero by 2050 Graphic shows that we need to work together to plan for a range of future climate scenarios, including a 4 C rise by end of century. Graphic also shows that the government is committed to restoring or creating more wetland and water features as part of a Nature Recovery Network, with 500,000ha of new or restored wildlife rich habitat at its heart Creating more wetland habitat 4oC the government is committed to restoring or creating more wetland and water features as part of a Nature Recovery Network, with 500,000ha of new or restored wildlife rich habitat at its heart work together to plan for a range of future climate scenarios, including a 4 C rise by end of century
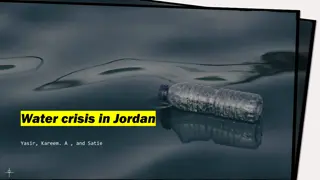
Agriculture and rural land management. 2.9 million tonnes 40% Whats the problem ? of top soil are lost every year due to erosion in England and Wales. In 2010, soil degradation in England and Wales was estimated to cost 1.2bn year of water bodies impacted by pollution from rural areas 50% 25% 16% contribution from agriculture to the total phosphorus load to freshwaters percentage of serious pollution incidents in England attributed to the agriculture sector 19,766 17% What outcomes are being achieved farms have engaged with Catchment Sensitive Farming since 2006 decrease in pollution incidents in Catchment Sensitive Farming target areas since 2006
Agriculture and rural land management. 2.9 million tonnes Alt text Graphic shows that 40% of water bodies are impacted by pollution from rural areas. Graphic also shows 2.9 million tonnes of top soil are lost every year due to erosion in England and Wales, and that in 2010 soil degradation in England and Wales was estimated to cost 1.2 billion a year 40% of top soil are lost every year due to erosion in England and Wales. In 2010, soil degradation in England and Wales was estimated to cost 1.2bn year of water bodies impacted by pollution from rural areas Alt text Graphic shows that 16% of serious pollution incidents in England are attributed to the agriculture sector. Graphic also shows that agriculture contributes 25% to the total phosphorus load to freshwaters 25% 16% contribution from agriculture to the total phosphorus load to freshwaters percentage of serious pollution incidents in England attributed to the agriculture sector Alt text Graphic shows that there is a 17% decrease in pollution incidents at Catchment Sensitive Farming targeted areas since the initiative began from 2006 to 2018 and that 19766 farm holdings have been engaged with catchment sensitive farming 17% 19,766 decrease in pollution incidents in Catchment Sensitive Farming target areas since 2006 farms have engaged with Catchment Sensitive Farming since 2006
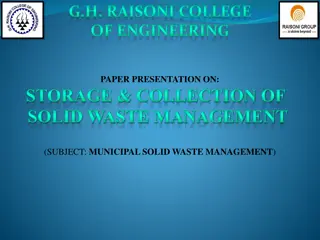
Waste water. More than 50 7,500 Whats the problem ? combined sewer overflows, out of a total of 15,000, have been improved since 1990 serious pollution incidents per year due to water companies 5.3 billion 9,164 km Whats being done ? What outcomes are being achieved is the amount of water company investment and projected investment towards WFD objectives from 2009 to 2025 of rivers and estuaries predicted to be protected and improved through water company plans from 2020-2025
Alt text Graphic shows that there were more than 50 serious pollution incidents per year due to water companies. Graphic also shows that 7,500 combined sewer overflows out of 15,000 have been improved since 1990 More than 50 7,500 combined sewer overflows, out of a total of 15,000, have been improved since 1990 serious pollution incidents per year due to water companies 5.3 billion 9,164 km Alt text Graphic shows 9,164 km of rivers and estuaries predicted to be protected and improved through water company plans from 2020-2025 and 5.3 billion is the amount of water company investment and projected investment towards WFD objectives from 2009 to 2025 is the amount of water company investment and projected investment towards WFD objectives from 2009 to 2025 of rivers and estuaries predicted to be protected and improved through water company plans from 2020-2025 Alt text Graphic shows