Addressing Needs in Biology Through Collaboration at Cal Poly
Explore how Cal Poly fosters collaborations between biologists and statisticians to enhance students' understanding of statistics in biology courses. From tailored materials to revamped lab courses, see how these efforts aim to improve multivariable thinking and experimental design skills.

Download Presentation

Please find below an Image/Link to download the presentation.
The content on the website is provided AS IS for your information and personal use only. It may not be sold, licensed, or shared on other websites without obtaining consent from the author. If you encounter any issues during the download, it is possible that the publisher has removed the file from their server.
You are allowed to download the files provided on this website for personal or commercial use, subject to the condition that they are used lawfully. All files are the property of their respective owners.
The content on the website is provided AS IS for your information and personal use only. It may not be sold, licensed, or shared on other websites without obtaining consent from the author.
E N D
Presentation Transcript
Part 1: Addressing Needs in Biology PRESENTERS: JAMIE BUNTING ELENA KEELING KAREN MCGAUGHEY 1
Outline Collaboration between biologists and statisticians at Cal Poly Example 1: Introductory Biology Lab Course Example 2: Workshops for M.S. students 2
Collaborations at Cal Poly Between Biology and Statistics Faculty: Need: Students take bio courses that use statistics BEFORE their statistics course(s) Bio grad students are coming in with only 1 statistics course, sometimes more than 2 or 3 years prior to entering their M.S. program Goals: Provide succinct, just-in-time materials based on sound statistics education pedagogy that Bio faculty and students can leverage Focus on multivariable thinking (sources of variation, design, confounding, replication etc.) 3
Example: Introductory biology lab course Course: 3rd in introductory biology sequence Incoming Biology majors most students take as freshmen, with no statistics coursework yet weekly 3-hour lab goals of lab include understanding of experimental design, data collection & basic analysis Challenges: broad & varied biology content in course- desire to expose students to many different concepts & techniques in lab most labs taught by M.S. student TAs w/varying statistics background 4
Example: Introductory biology lab course Changes (jointly developed by biologists & statisticians): group worksheets guide through consideration of variables, confounding, & designing an experiment data collection standardized so groups can pool data students use simulation applets regularly final report- includes t test, graph of class data, & questions about experimental design TA training by statistics faculty alignment of language with that used in statistics courses Assessment: in progress pre & post surveys of conceptual understanding & attitudes toward statistics 5
Sample worksheet questions 1. How will you set up the independent/explanatory variable? (w/specific prompts) 2. How will you measure the dependent/response variable? (w/specific prompts) 3. Multivariable thinking: What conditions/variables outside of the independent variable may influence your results? Which of the variables mentioned can be controlled, and how? What can you do to minimize the effect of variables for which you cannot control? 6
Lessons learned/advice For students: need to repeatedly emphasize the connections and distinctions between statistics and biology e.g. statistical significance vs. biological relevance For faculty planning collaborations: need multiple conversations between statisticians & biologists challenging to find the time statisticians & biologists use the same words to mean different things, and different words to mean the same things having statistics faculty directly train graduate student teaching assistants is important 7
Example: Workshops for biological sciences M.S. students Context: M.S. students in interdisciplinary program (biology, biomedical engineering, animal science Curriculum now includes 1 statistics course (assume 1 statistics course as undergraduates) 3 Workshops/year/cohort (prior to change in curriculum) 2-hours each (Fall, Spring, Summer) Mostly short examples on various topics with Q&A 8
Example: Workshops for biological sciences M.S. students Fall: Statistics refresher Multivariable thinking Replication Measuring and thinking about sources of variation Graphical displays Inference (t-test, paired t- test) Spring: Design of Experiments Multivariable thinking Inclusion criteria, direct control, random assignment, general randomization, confounding Scope of conclusions Summer: Data Analysis Multivariable thinking Adjusting for covariates Removing block effects Interaction Methods: ANOVA regression logistic regression Blocking Replication 9
Lessons learned/advice For students: For most students it s been a year or more since the first statistics course and they ve forgotten a lot It can be overwhelming to think about carrying out own research study with only 1 or 2 stat classes under your belt decisions about sources of variability, the design, the analysis which all need to be made before the study Multivariable thinking is challenging technical vs. biological replicates For faculty: short (1-2 hr) workshops lead by statisticians may be a good strategy to increase statistical training in client departments, not only for students, but faculty as well, could initiate collaborations funding makes everything easier 10
Q&A Do you have examples of ways in which you are collaborating with other disciplines at your institutions to improve statistical understanding? Questions/comments? 11
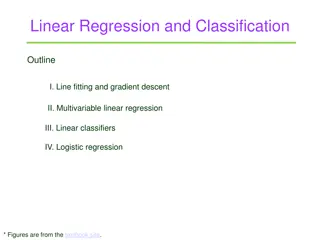
Part 2: Multivariable Thinking in a Second Course in Statistics 12
Outline The second course in statistics & multivariable thinking Introducing multivariable thinking to students Example 1: Sources of variability in a response Reinforcing multivariable thinking throughout the course Example 2: Blocking on a source of variability Example 3: Adjusting for a confounding variable (categorical) Example 4: Adjusting for a confounding variable (quantitative) 13
Second course in statistics Non-stat majors (biology, marine science, psychology, communications, computer science, etc.) Algebra-based Required for a few majors, but the vast majority of students take it as an elective (some towards a minor in Statistics) Over the last 3-years Cal Poly has gone from teaching 2-sections (~70 students) per year to 6-sections (210 students) per year Often taught in a lecture/lab format 14
Second course and multivariable thinking Recognize that variation in a response comes from many, many sources and be able to identify those sources Recognize that relationships discovered in a statistical analysis and/or data visualization between two variables (e.g., a response and explanatory variable) depend in large part how the study has dealt with many other variables that may influence that response. Design studies that effectively control for the many variables that may influence the response (e.g., blocking, inclusion criteria, direct control, etc.) Analyze data in the presence of confounding and bias Draw appropriate conclusions from a data analysis and convey the limitations of these conclusions 15
Teaching multivariable thinking in the second course Use data visualization as much as possible to teach the ideas of: Explaining variation Confounding Adjusting for another variable Interaction Use simulation to reinforce: Null distribution and variability arising from random assignment and/or random sampling Statistical significance 16
Thinking about reasons for variation Example 1: Histogram of birthweights (in grams) for all babies born in the U.S. in January 2016 Brainstorm: What are some reasons for the variability in birth weights? Answers: Genetics Premature birth or not Mother s nutrition Mother s stress Mother s body weight Baby s sex Unknown 17
Sources of variation diagram SD of birth weight = 592g 18
Explained vs. Unexplained variation R2 22% 19
Accounting for a second source of variability in the model SD of birth weight = 592g R2 23.5% 20
Accounting for a source of variation by design Example 2: Stimulants and finger tapping 3 stimulants: caffeine, theobromine (chemical in chocolate), placebo Response: finger tapping rate measured 2-hours after ingestion What are some potential sources of variation in finger tapping rates? Type of pill/stimulant Previous caffeine use that day Size/amount of the pill Time after ingestion at which the test is run How finger tapping rate is measured Time of day Manufacturer Age Inherent finger tapping ability Attitude/willingness to participate Whether the person is regular caffeine user Sleep Metabolism Unknown 21
Analysis: One-variable model Model: finger tapping rate stimulant Why is the F-statistic so small? Answer: Lots of unexplained variation 22
One-variable model sources of variation diagram Person-to-person variation 481 479 462 ?? ? ????????? ?? ???????? ?? ??????? ????????? ??????? ???? = ,?? ?? ????????? = 25.41 R2 13% 23
Accounting for variation by design Actual study design: 4 study participants: each participant was measured using each stimulant (in random order) Block or repeated measures design, blocking on person Person-to-person variation 24
Analysis of a block design Needs to take into account the person-to-person variation Analysis #1: Adjust the simulation to reflect the within person random assignment used in the study Analysis #2: Account for the person effects in the finger tapping rates One Blocking Variable Applet 25
Account for the person-to-person variation by simulation One Blocking Variable Applet Shuffle within blocks 26
Account for person-to-person variation by removing the person effects Treatment means stay the same Within treatment variation decreases 27
Adjusting for a confounding variable Example 3: Car Acceleration Time (in seconds) it takes a car to accelerate to 60 mph What features of a car might explain faster acceleration times? SD = 2.76 sec R2 6.7% 29
Pairwise relationships Faster EV: Car Weight RV: Acceleration CV Horsepower 30
Adding horsepower to the model EV: Car Weight + Horsepower RV: Acceleration 31
Adjusting for horsepower Remove the effect of horsepower from acceleration what will happen to the blue dots? The red dots? Cars with higher hp have faster (lower) times Cars with lower hp have slower (higher) times 32
Adjusting for a continuous predictor Example 4: Car Acceleration (regression) EV: Car Weight RV: Acceleration CV Horsepower 33
Hp adjusted linear association between acceleration and car weight 35
Summary Thinking about sources of variation is an important skill (in both randomized experiments and observational studies) Use simple data visualizations to show what it means to adjust for a variable (blocking variable or confounding variable) Use simulation to reinforce the idea of the null distribution and statistical significance with an emphasis on the simulation matching the design Additional multivariable topics: Interaction in factorial studies and in regression models Collinearity 36
Q&A Second course is all about multivariable thinking, but often is taught as disparate analysis methods (e.g., t-test, ANOVA, regression, chi-square, etc.) What are some ways you all try to weave this together and create a unified approach? Are there other important multivariable ideas that need to be stressed in the second course so that students who only see 2 courses in statistics can be successful in a data-centric world and job market? Other questions? Comments? 37