Advanced Applications of XRD and XRF Techniques for Non-Destructive Analysis
Explore the advanced applications of X-ray Diffraction (XRD) and X-ray Fluorescence (XRF) techniques, including the limitations and benefits. Learn how these techniques provide speedy, accurate, and reproducible results in analyzing various materials such as crime scene evidence. Discover the synergy of high-resolution Computed Tomography scanning with XRD or XRF for reliable non-destructive analysis.

Download Presentation

Please find below an Image/Link to download the presentation.
The content on the website is provided AS IS for your information and personal use only. It may not be sold, licensed, or shared on other websites without obtaining consent from the author. If you encounter any issues during the download, it is possible that the publisher has removed the file from their server.
You are allowed to download the files provided on this website for personal or commercial use, subject to the condition that they are used lawfully. All files are the property of their respective owners.
The content on the website is provided AS IS for your information and personal use only. It may not be sold, licensed, or shared on other websites without obtaining consent from the author.
E N D
Presentation Transcript
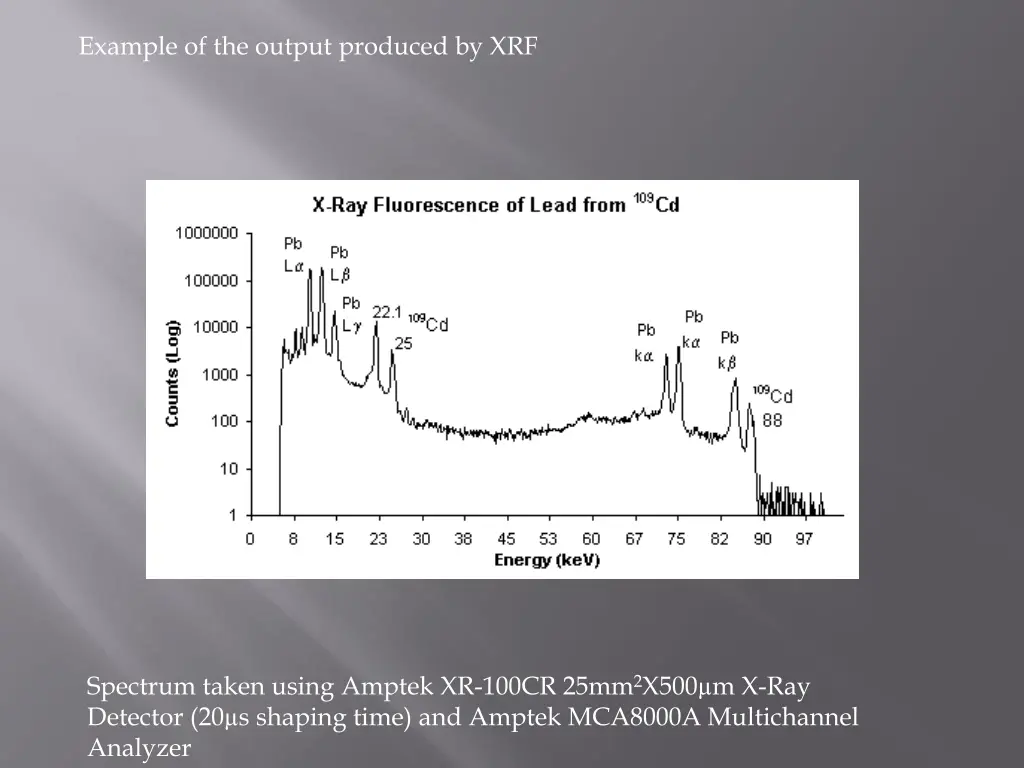
Example of the output produced by XRF Spectrum taken using Amptek XR-100CR 25mm2X500 m X-Ray Detector (20 s shaping time) and Amptek MCA8000A Multichannel Analyzer
Limitations of XRF - can t differentiate between different isotopes of the same element - can t differentiate between ions of the same element in a different valence state only capable of measuring elements from Beryllium to Uranium
Sample bombarded by external primary excitation. 1. The high energy of the gamma ray engenders the ejection of an electron from the innermost orbital (labeled K) of an atom. At this point the atom is rendered unstable. 2. As an electron from the orbital L or orbital M fills the vacancy in orbital K, the electrons give off a characteristic x ray. 3. Meanwhile a vacancy has occurred in orbital L or orbital M, and the electrons in orbital M or orbital N fill in the vacancy. Giving off another unique x ray. 4.
Light source is a gamma ray which causes ionization due to its high energy. There are several types of detectors Si Ge PIN diode Silicon Drift Detector
XRD and XRF are becoming more used as part of a routine analysis. Adding high resolution Computed Tomography scanning with XRD or XRF allows for the most reliable and non destructive analysis. -tomography-is the imaging by sections or sectioning through the use of wave energy.
XRD and XRF techniques both provide date that is: Speedy, accurate and give reproducible results Simple Non destructive in nature of measurement These techniques are used with various crime scene evidence such as: explosive or bullet reside, soil samples, paint chips, duct tape, drugs, and cosmetics
XRF spectrometer is an x-ray instrument used for routine, non destructive chemical analysis. Works on wavelength dispersive spectroscope principles, which is similar to electron microprobe. Easy to prep, and the stability allows for x-ray spectrometers to be a commonly used method for analysis of trace evidence.
1) XRD bends magnet radiation, which is monochromated by way of a double multilayer monochromater (DMM) 2) Energy is selected (30keV beam) Focused on the paint multilayer fragment by using a single bounce capillary to a spot size of 15 m. 3) An area detector (8 m pixel size) was placed behind the sample in order to get the 2D diffraction pattern. 4) A silicon detector at 90 with respect to incoming beam, which produces a fluorescent spectra. XRF(element distribution in a cross section) XRD(cyrstallographic phase distribution)
Figure 2 Combined -XRF/XRD tomography on a layered paint fragment at a synchrotron microfocus beamline. For each translation rotation step (xi , k ) an XRF spectrum and 2D- XRD pattern are produced. The corresponding radial scatter profile, obtained by azimuthal integration of the CCD-camera image, can be decomposed in several crystallographic phase contributions. The S-coefficients form the sinograms Sc(x, ) from which distribution maps gc(x, y) are calculated.
XRD XRF XRF Figure 3. MLEM reconstruction of Pawley scaling factors of titanium dioxide and barium sulfate from XRD data in the first column, along with their major elements, titanium and barium from XRF data in the second column, showing the presence of rutile in three paint layers and barite in two layers. Two trace elements, strontium and niobium, show less absorption because of their higher energetic emission lines. Sinogram dimensions are 1.2 mm(15- m steps) by 180 (3 steps). Tomogram dimensions are 1.2 1.2mm (15 15 msteps).
De Nolf, W., Janssens, K. (2009). Micro X-ray diffraction and fluorescence tomography for the study of multilayered automotive paints. Wiley Interscience. http://serc.carleton.edu/research_education/geochemsheets/techniqu es/XRF.html http://www.panalytical.com/index.cfm?pid=130 http://www.amptek.com/xrf.html http://www.panalytical.com/index.cfm?pid=873&itemid=154&content itemid=46


 XRD bends magnet radiation, which is")


. Micro X-ray diffraction")