Advanced Data Analysis Techniques Using Python Mapper and Real Datasets
Explore advanced data analysis techniques with Python Mapper on real datasets. Create informative slides showcasing Python Mapper outputs and work with real data sets for hands-on experience. Enhance your understanding of TDA Mapper through illustrations and practical applications.
Download Presentation

Please find below an Image/Link to download the presentation.
The content on the website is provided AS IS for your information and personal use only. It may not be sold, licensed, or shared on other websites without obtaining consent from the author. If you encounter any issues during the download, it is possible that the publisher has removed the file from their server.
You are allowed to download the files provided on this website for personal or commercial use, subject to the condition that they are used lawfully. All files are the property of their respective owners.
The content on the website is provided AS IS for your information and personal use only. It may not be sold, licensed, or shared on other websites without obtaining consent from the author.
E N D
Presentation Transcript
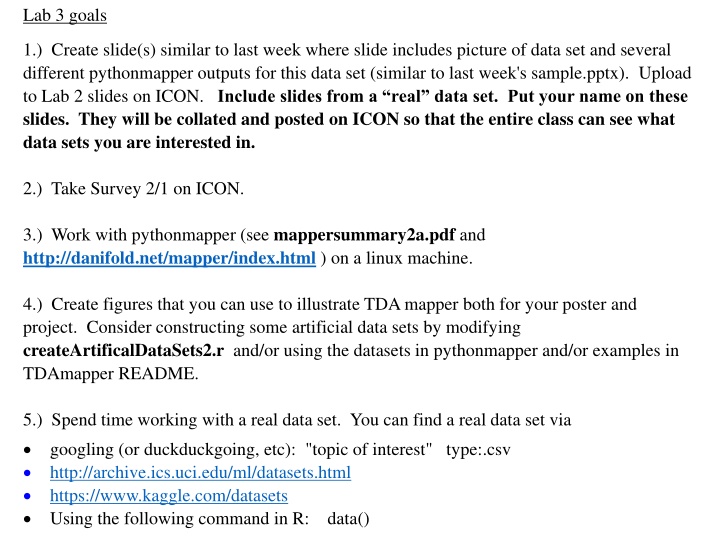
Lab 3 goals 1.) Create slide(s) similar to last week where slide includes picture of data set and several different pythonmapper outputs for this data set (similar to last week's sample.pptx). Upload to Lab 2 slides on ICON. Include slides from a real data set. Put your name on these slides. They will be collated and posted on ICON so that the entire class can see what data sets you are interested in. 2.) Take Survey 2/1 on ICON. 3.) Work with pythonmapper (see mappersummary2a.pdf and http://danifold.net/mapper/index.html ) on a linux machine. 4.) Create figures that you can use to illustrate TDA mapper both for your poster and project. Consider constructing some artificial data sets by modifying createArtificalDataSets2.r and/or using the datasets in pythonmapper and/or examples in TDAmapper README. 5.) Spend time working with a real data set. You can find a real data set via googling (or duckduckgoing, etc): "topic of interest" type:.csv http://archive.ics.uci.edu/ml/datasets.html https://www.kaggle.com/datasets Using the following command in R: data()
From: createArtificalDataSets2.r You can also clean up data using excel, python scripts, etc.
mapper.filters.dm_eigenvector(data, k=0, mean_center=True, metricpar={}, verbose=True, callback=None) Return the k-th eigenvector of the distance matrix. The matrix of pairwise distances is symmetric, so it has an orthonormal basis of eigenvectors. The parameter k can be either an integer or an array of integers (for multi-dimensional filter functions). The index is zero-based, and eigenvalues are sorted by absolute value, so k=0 returns the eigenvector corresponding to the largest eigenvalue in magnitude. If mean_center is True, the distance matrix is double-mean- centered before the eigenvalue decomposition. Reference: [R6], subsection Principal metric SVD filters .
Distance Matrix Eigenvector Order of eigenvector: 0
Distance Matrix Eigenvector, Mean Centered Distance Matrix Order of eigenvector: 0
Distance Matrix Eigenvector, Mean Centered Distance Matrix Order of eigenvector: 1
Distance Matrix Eigenvector, Mean Centered Distance Matrix Order of eigenvector: 0 5 intervals, 50% Overlap
Distance Matrix Eigenvector, Mean Centered Distance Matrix Order of eigenvector: 1 5 intervals, 50% Overlap
Distance Matrix Eigenvector, Mean Centered Distance Matrix Order of eigenvector: 1 20 intervals, 20% Overlap
Distance Matrix Eigenvector, Mean Centered Distance Matrix Order of eigenvector: 1 20 intervals, 50% Overlap
Distance Matrix Eigenvector, Mean Centered Distance Matrix Order of eigenvector: 1 20 intervals, 80% Overlap
Distance Matrix Eigenvector, Mean Centered Distance Matrix Order of eigenvector: 1 20 intervals, 80% Overlap --Balanced
Metric: Euclidian Filter Function: Eccentricity with exponent = 1 Cover: Uniform 1-d cover Clustering: Single modified slide from Maria Gommel
knn distance with k = 5 and 3 bins??? [ ( ) ( ) ]


