Advanced Energy Forecasting Analysis for July 2024
Dive into the detailed analysis of Intra-Hour IRR Forecast Accuracy Updates and Current GTBD Parameters with Predicted Wind and Solar Ramp Rate Errors for July 2024. Gain insights into performance metrics and persistence ramps in energy forecasting.
Download Presentation

Please find below an Image/Link to download the presentation.
The content on the website is provided AS IS for your information and personal use only. It may not be sold, licensed, or shared on other websites without obtaining consent from the author. If you encounter any issues during the download, it is possible that the publisher has removed the file from their server.
You are allowed to download the files provided on this website for personal or commercial use, subject to the condition that they are used lawfully. All files are the property of their respective owners.
The content on the website is provided AS IS for your information and personal use only. It may not be sold, licensed, or shared on other websites without obtaining consent from the author.
E N D
Presentation Transcript
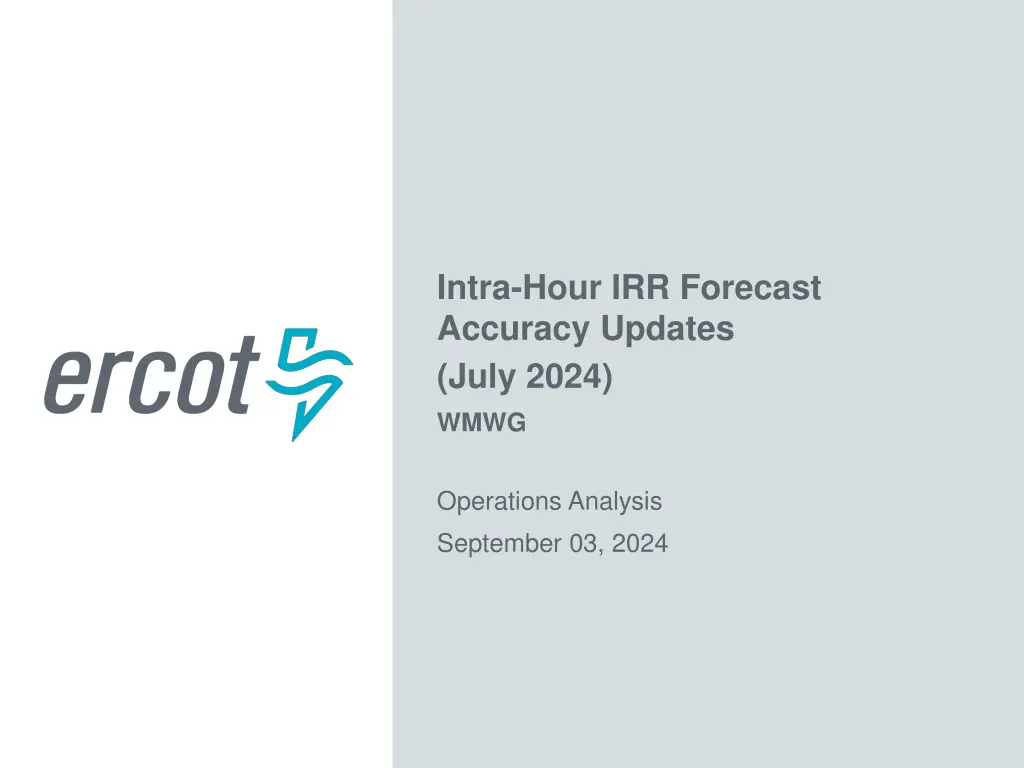
Intra-Hour IRR Forecast Accuracy Updates (July 2024) WMWG Operations Analysis September 03, 2024
Current GTBD Parameters GTBD Component Tuning events: None 0.00 K1 0.00 K2 1.00 K3 0.20 K4 0.50 K5 1.00 K6 1.00 K7 1.00 K8 350.00 Integral ACE Cap 30.00 PWRR Cap 40.00 PSRR Cap 20.00 PDCTRR Cap 2 PUBLIC
Predicted Wind Ramp Rate (PWRR) Error Persistence Ramp* Performance Metric SCED PWRR Monthly MAE (MW per 5 minutes) 112 79 Monthly MAE when 5-Min. Wind Ramp > 100 MW 193 115 5-min Ahead Predicted Wind Ramp Error (July 2024) Persistence Ramp Error [MW] SCED PWRR Error [MW] 2500 <--- DO NOT MOVE GRAPH 2000 Count of 5-min Intervals 1500 1000 500 0 <-300 -300 to - -250 to - 200 -200 to - 150 -100 to - 50 Error in MW per 5 minutes (Predicted Wind Ramp - Actual Wind Ramp) -150 to - 100 -50 to 0 0 to 50 50 to 100 100 to 150 150 to 200 200 to 250 250 to 300 >300 250 * Persistence Ramp assumes a 0 MW wind ramp 3 PUBLIC
Predicted Solar Ramp Rate (PSRR) Error Persistence Ramp* PSRR, IHPPF PSRR, STPPF Performance Metric SCED PSRR Monthly MAE (MW per 5 minutes) 249 139 169 138 Monthly MAE when 5-Min. Solar Ramp > 100 MW 339 158 189 156 5-min Ahead Predicted Solar Ramp Error (July 2024) Excluding Intervals where Solar HSL < 5 MW Persistence Ramp Error [MW] SCED PSRR Error [MW] IHPPF PSRR Error [MW] STPPF PSRR Error [MW] <--- DO NOT MOVE GRAPH 1000 900 800 700 Count of 5-min Intervals 600 500 400 300 200 100 0 <-300 -300 to - -250 to - 200 -200 to - 150 -100 to - 50 Error in MW per 5 minutes (Predicted Solar Ramp - Actual Solar Ramp) -150 to - 100 -50 to 0 0 to 50 50 to 100 100 to 150 150 to 200 200 to 250 250 to 300 >300 250 * Persistence Ramp assumes a 0 MW solar ramp 4 PUBLIC

