Advanced Imaging and Analysis of Liver Cirrhosis Treatment Outcomes
Explore the impact of direct-acting antivirals (DAAs) on patients with HCV-related compensated cirrhosis through endoscopic examinations, portal vein thrombosis assessments, and hepatic venous pressure gradient (HVPG) values. Supplementary figures detail patient cohorts, endoscopy performance rates, and HVPG changes pre- and post-treatment. Discover insights into hepatic decompensation risk factors and outcomes post-DAAs.

Download Presentation

Please find below an Image/Link to download the presentation.
The content on the website is provided AS IS for your information and personal use only. It may not be sold, licensed, or shared on other websites without obtaining consent from the author. If you encounter any issues during the download, it is possible that the publisher has removed the file from their server.
You are allowed to download the files provided on this website for personal or commercial use, subject to the condition that they are used lawfully. All files are the property of their respective owners.
The content on the website is provided AS IS for your information and personal use only. It may not be sold, licensed, or shared on other websites without obtaining consent from the author.
E N D
Presentation Transcript
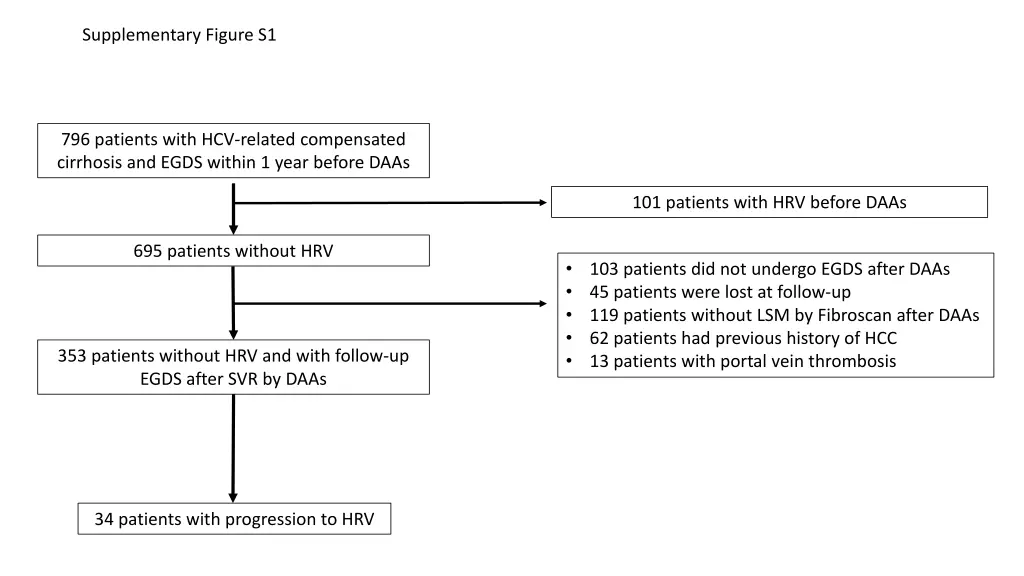
Supplementary Figure S1 796 patients with HCV-related compensated cirrhosis and EGDS within 1 year before DAAs 101 patients with HRV before DAAs 695 patients without HRV 103 patients did not undergo EGDS after DAAs 45 patients were lost at follow-up 119 patients without LSM by Fibroscan after DAAs 62 patients had previous history of HCC 13 patients with portal vein thrombosis 353 patients without HRV and with follow-up EGDS after SVR by DAAs 34 patients with progression to HRV
Supplementary Figure S2 Endoscopies correctly performed per 100 patients 10 8 6 4 2 0 Risk threshold of missing HRV (false negative)
Supplementary Figure S3 BAVENO VI IN (n=3) BAVENO VI OUT (n=43) 20 20 19 19 18 18 17 17 16 16 15 15 14 14 HVPG value HVPG value 13 13 12 12 11 11 10 10 9 9 8 8 7 7 6 6 5 5 4 4 3 3 2 2 1 1 0 0 HVPG BL HVPG Post Tx HVPG BL HVPG Post Tx HVPG after SVR by DAAs HVPG after SVR by DAAs HVPG before DAAs HVPG before DAAs p<0.001 p<0.001
Supplementary Figure S4 EXP BAVENO VI IN (n=20) EXP BAVENO VI OUT (n=26) 20 20 19 19 18 18 17 17 16 16 15 15 14 14 HVPG value HVPG value 13 13 12 12 11 11 10 10 9 9 8 8 7 7 6 6 5 5 4 4 3 3 2 2 1 1 0 0 HVPG BL HVPG Post Tx HVPG BL HVPG Post Tx HVPG after SVR by DAAs HVPG after SVR by DAAs HVPG before DAAs HVPG before DAAs p<0.001 p<0.001