Advanced Multivariate Statistical Process Control Techniques in Pharmaceuticals
Explore the advantages of Multivariate Statistical Process Control (MSPC) over Univariate SPC in pharmaceutical processes. Learn about techniques like PCA and PLS, monitoring mean and dispersion, and detecting special causes of variation.
Download Presentation

Please find below an Image/Link to download the presentation.
The content on the website is provided AS IS for your information and personal use only. It may not be sold, licensed, or shared on other websites without obtaining consent from the author. If you encounter any issues during the download, it is possible that the publisher has removed the file from their server.
You are allowed to download the files provided on this website for personal or commercial use, subject to the condition that they are used lawfully. All files are the property of their respective owners.
The content on the website is provided AS IS for your information and personal use only. It may not be sold, licensed, or shared on other websites without obtaining consent from the author.
E N D
Presentation Transcript
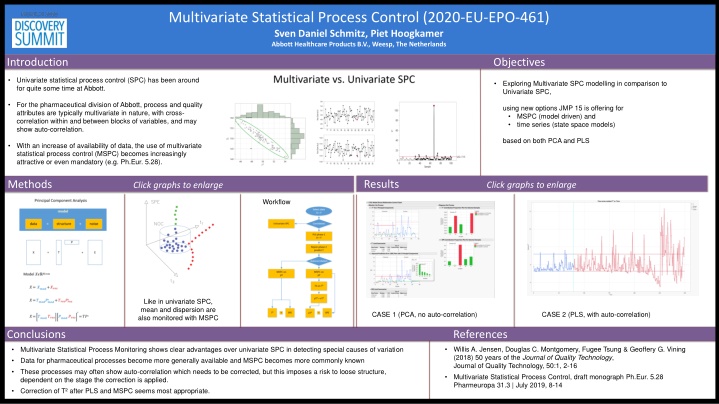
[2/19/2020 3:32 PM] Schmitz, Sven Daniel: Multivariate Statistical Process Control (2020-EU-EPO-461) Multivariate Statistical Process Control (2020-EU-EPO-461) Sven Daniel Schmitz, Piet Hoogkamer Abbott Healthcare Products B.V., Weesp, The Netherlands Introduction Objectives Univariate statistical process control (SPC) has been around for quite some time at Abbott. Exploring Multivariate SPC modelling in comparison to Univariate SPC, For the pharmaceutical division of Abbott, process and quality attributes are typically multivariate in nature, with cross- correlation within and between blocks of variables, and may show auto-correlation. using new options JMP 15 is offering for MSPC (model driven) and time series (state space models) based on both PCA and PLS With an increase of availability of data, the use of multivariate statistical process control (MSPC) becomes increasingly attractive or even mandatory (e.g. Ph.Eur. 5.28). Results Methods Click graphs to enlarge Click graphs to enlarge Workflow Like in univariate SPC, mean and dispersion are also monitored with MSPC CASE 1 (PCA, no auto-correlation) CASE 2 (PLS, with auto-correlation) Conclusions References Willis A. Jensen, Douglas C. Montgomery, Fugee Tsung & Geoffery G. Vining (2018) 50 years of the Journal of Quality Technology, Journal of Quality Technology, 50:1, 2-16 Multivariate Statistical Process Control, draft monograph Ph.Eur. 5.28 Pharmeuropa 31.3 | July 2019, 8-14 Multivariate Statistical Process Monitoring shows clear advantages over univariate SPC in detecting special causes of variation Data for pharmaceutical processes become more generally available and MSPC becomes more commonly known These processes may often show auto-correlation which needs to be corrected, but this imposes a risk to loose structure, dependent on the stage the correction is applied. Correction of T after PLS and MSPC seems most appropriate.
Multivariate vs. Univariate SPC Multivariate statistical process control has a clear advantage over univariate statistical process control in that cross-correlation between observed variables allow for higher sensitivity of detecting special causes of variation. This also resembles the general theory of analytical chemistry as defined by Booksh and Kowalski (Analytical Chemistry, 66 (1994) 782A-791A), relating complexity of information to intrinsic information content.
PCA and PLS Partial Least Squares Analysis PCA finds the latent variables which explain best the variance in X, while PLS finds latent variables which best explain the variance in Y
Monitoring Mean and Dispersion In univariate SPC, typically both mean (observed value) and dispersion (moving range) are charted. In multivariate SPC the same is done, using Hotelling s T and SPE (standard prediction error) statistics. CASE 1 data red = training, blue = monitoring In case the reduced dimension is spanned by just two latent variables, this can be depicted as above. For a stationary process (common cause variability), these statistics are contained within the NOC (normal operating conditions) cylinder. Special cause variability may cause values outside the NOC, which are still in line with the model (red diamonds) or are no longer adequately described by the model (green squares). Multivariate statistical process control in chromatography. A. Nijhuis, S. de Jong, B.G.M. Vandeginste, Chemometrics and Intelligent Laboratory Systems 38 (1997) 51-62
Options for correction of auto-correlation using time-series (TS) Proposed Workflow, avoiding loss of structure in TS correction 1.Subset by phase 2.Fit PLS on phase 1, store prediction formulae (pY) 3.Concatenate phase 2, save and evaluate formulae 4.Apply model driven MSPC 5.Save T and SPE 6.Fit state space model on T 7.Calculate residual T (= eT ) 8.Fit distribution, calculate quantiles for control limits 9.Plot eT and SPE Dim(X+Y) > Dim(PLS) > Dim(MSPC) The idea to apply time series correction of auto-correlation on T is inspired by Xuan Huang & Davit Khachatryan (2018) Dimension reduction for a multivariate time series process of a regenerative glass furnace, Journal of Quality Technology, 50:1, 98-116 More (simulated) cases are needed to learn whether this is a valid approach in general.
CASE 1: PCA based MSPC without auto-correlation For a one-block dataset without auto-correlation, the outcome of the PCA based MSPC is shown, with a (training ) phase 1 and (monitoring) phase 2. For the monitoring data, for some points contribution proportions are shown using new JMP15 graphlet functionality, univariate OOC s are shown in red. Sample 46 (T ) and 47 (SPE) are OOC in a multivariate sense but not in an univariate sense. Samples 36 and 37 are OOC in both univariate and multivariate sense. This dataset is taken from the R-MSQC package, originally named bimetal1 and bimetal2 with 5 variables. Title: Multivariate Statistical Quality Control Version: 1.0.2 Date: 2016-05-30 Author: Edgar Santos-Fernandez
CASE 2: PLS based MSPC with auto-correlation Residual T values for time series model, with SHASH based control limits. Phase 1 (training) in blue Phase 2 (monitoring) in red. After PLS and MSPC, auto-correlation is still present in T but no longer in SPE. This dataset is based on cleansed data with X = f1 .. f7 sieve fraction values and Y = d1 .. d4 dissolution values. PLS was used to reduce the dimension to 4 and subsequently MSPC further to 1.

