Advanced Sampling Methods and Response Rate Improvement
Nonresponse in survey research can lead to biased results. Understanding factors influencing nonresponse and implementing strategies to reduce refusals are crucial for valid data collection. Learn about the impact of nonresponse, groups affected by nonresponse bias, and effective methods to increase response rates and reduce refusals.

Download Presentation

Please find below an Image/Link to download the presentation.
The content on the website is provided AS IS for your information and personal use only. It may not be sold, licensed, or shared on other websites without obtaining consent from the author. If you encounter any issues during the download, it is possible that the publisher has removed the file from their server.
You are allowed to download the files provided on this website for personal or commercial use, subject to the condition that they are used lawfully. All files are the property of their respective owners.
The content on the website is provided AS IS for your information and personal use only. It may not be sold, licensed, or shared on other websites without obtaining consent from the author.
E N D
Presentation Transcript
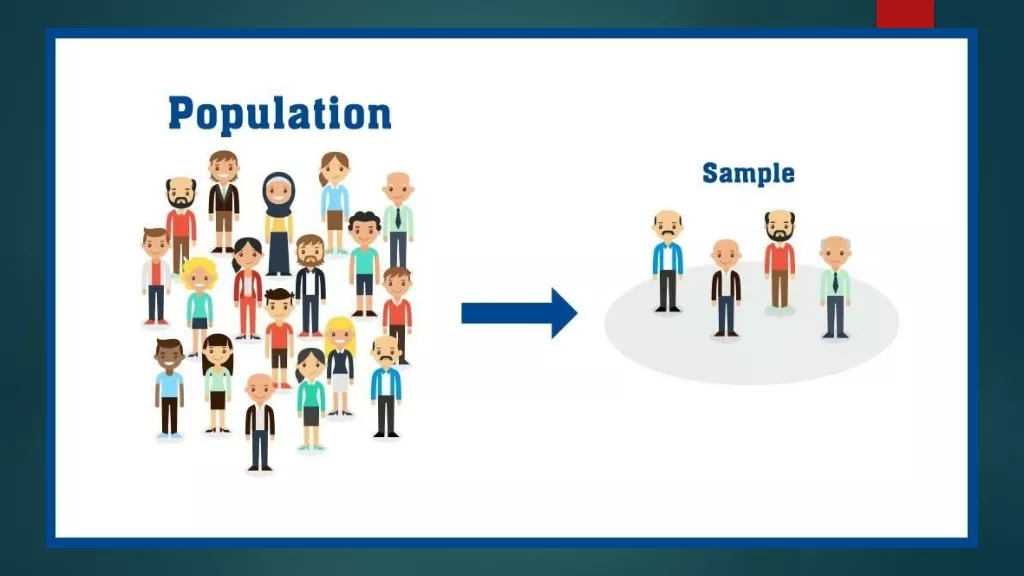
Marketing Analytic Lecture on Advanced Sampling Dr. Marv Khammash Marketing Faculty University of Sussex Business School
The problem of nonresponse in sampling Nonresponse is a major problem in survey research. Nonrespondents differ between respondents on demographic, psychographic, personality, attitudinal, motivational, and behavioral dimensions. If nonrespondents differ significantly on key characteristics of the study, the results will be biased. Increasing the response rate, though not a perfect indicator, is likely to decrease the probability of nonresponse error.
Groups most likely to be affected due to not being at home to respond Note that the likelihood of potential respondents not being at home varies with several factors. Families with small children are more likely to be at home as compared to single people. Consumers are more likely to be at home on weekends than on weekdays and in the evening as opposed to the afternoon. Additional efforts must be made to adjust for the nonresponse of these groups.
Six methods to Reduce Refusals of Respondents Refusals, which result from the unwillingness or inability of people included in the sample to participate, result in lower response rates and increased potential for non-response bias. Refusal rates, the percentage of contacted respondents who refuse to participate, range from 0 to 50 percent or more in telephone surveys. Another study indicated that consumers prefer Internet surveys versus the telephone method of surveys.
Reducing Refusals Given the differences between responders and non- responders, researchers should lower refusal rates.This can be done by: 1. Prior notification: This increases response rates for samples of the general public because it reduces surprise and uncertainty and creates a more cooperative atmosphere. 2. Motivating the respondents: potential respondents can be motivated to participate in the survey by increasing their interest and involvement.
Reducing Refusals 3. Incentives: response rates can be increased by offering monetary as well as non-monetary incentives to potential respondents. Monetary incentives can be prepaid or promised. 4. Questionnaire design and administration: A well-designed questionnaire can decrease the overall refusal rate as well as refusals to specific questions. 5. Follow-up: Following up, or contacting nonrespondents periodically after the initial contact, is particularly effective in decreasing refusals in surveys. 6. Other facilitators: Personalisation, or sending letters addressed to specific individuals, is effective in increasing response rates.
Seven methods to Adjust for Nonresponse 1.Sub-sampling of Nonrespondents the researcher contacts a sub-sample of the nonrespondents, usually by means of telephone or personal interviews. 2. Replacement, nonrespondents in the current survey are replaced with nonrespondents from earlier, similar survey. Researchers attempt to contact these nonrespondents from earlier survey and administer the current survey questionnaire to them, possibly by offering a suitable incentive.
Adjusting for Nonresponse 3.Substitution, the researcher substitutes for nonrespondents other elements from the sampling frame that are expected to respond. The sampling frame is divided into subgroups that are internally homogeneous in terms of respondent characteristics but heterogeneous in terms of response rates. These subgroups are then used to identify substitutes who are similar to particular nonrespondents but dissimilar to respondents already in the sample.
Adjusting for Nonresponse 4.Subjective Estimates When it is no longer feasible to increase the response rate by sub-sampling, replacement, or substitution, it may be possible to arrive at subjective estimates of the nature and effect of nonresponse bias. This involves evaluating the likely effects of nonresponse based on experience and available information. 5.Trend analysis is an attempt to discern a trend between early and late respondents. This trend is projected to nonrespondents to estimate where they stand on the characteristic of interest.
Adjusting for Nonresponse 6.Weighting attempts to account for nonresponse by assigning differential weights to the data depending on the response rates. Example: in a survey the response rates were 85%, 70%, and 40%, respectively, for the high, medium, and low-income groups. In analysing the data, these subgroups are assigned weights inversely proportional to their response rates. That is, weights assigned would be (85/100), (70/100), and (40/100), respectively, for the high, medium, and low income groups.
Adjusting for Nonresponse 7.Imputation: It involves imputing, or assigning, the characteristic of interest to the nonrespondents based on the similarity of the variables available for both nonrespondents and respondents. For example, a respondent who does not report brand usage may be imputed or assigned the usage of a respondent with similar demographic characteristics. Often there is a high correlation between the characteristic of interest and some other variables. In such cases, this correlation can be used to predict the value of the characteristic for the nonrespondents.
International Marketing Research When conducting marketing research in foreign countries, statistical estimation of sample size can be difficult, because estimates of certain populations might be unavailable. When statistical estimation of sample size is attempted, the differences in estimates of populations should be recognised and factored in, if possible. When the goal is to examine differences across countries or international markets, it is desirable to have the same sample size across countries.
Marketing Research & Social Media It is feasible to have large, even very large, sample sizes when conducting marketing research in social media. In many social media projects, the sample size can far exceed that required by statistical considerations. It is important to address the issues of the appropriateness and representativeness of social media.
Mobile Marketing Research (1 of 2) It is feasible to have large sample sizes that exceed the statistical requirements, as the incremental cost and time of surveying additional respondents is only marginal. All the techniques for improving response rates that we have discussed can be implemented in the mobile context. Mobile users can be given the option to complete a short survey and be rewarded with an ad-free app environment. Other incentives that can be effective include online currencies (gold, coins, credits, power-ups, etc.) or any form of premium content, and are distributed to respondents after they have completed the survey.
Mobile Marketing Research (2 of 2) Mobile research can be more expensive than landlines. MMR may require more phone calls to be made to achieve the same number of completed surveys/interviews, due to factors such as call screening, refusals, and higher dropout rates. Thus, the initial sample size may be considerably higher in MMR compared to landlines in order to obtain the same final sample size.


")
")