Advanced Techniques for Network Analysis in Python and Gephi
Explore centralities in network analysis using Python and Gephi. Learn about closeness, eigenvector centrality, and how to rank nodes based on centralities. Discover resources for Gephi and key functionalities to enhance your analysis.

Uploaded on | 2 Views
Download Presentation

Please find below an Image/Link to download the presentation.
The content on the website is provided AS IS for your information and personal use only. It may not be sold, licensed, or shared on other websites without obtaining consent from the author. If you encounter any issues during the download, it is possible that the publisher has removed the file from their server.
You are allowed to download the files provided on this website for personal or commercial use, subject to the condition that they are used lawfully. All files are the property of their respective owners.
The content on the website is provided AS IS for your information and personal use only. It may not be sold, licensed, or shared on other websites without obtaining consent from the author.
E N D
Presentation Transcript
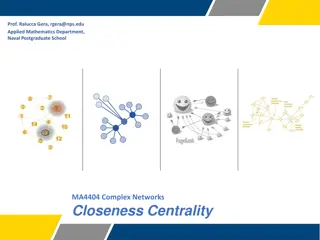
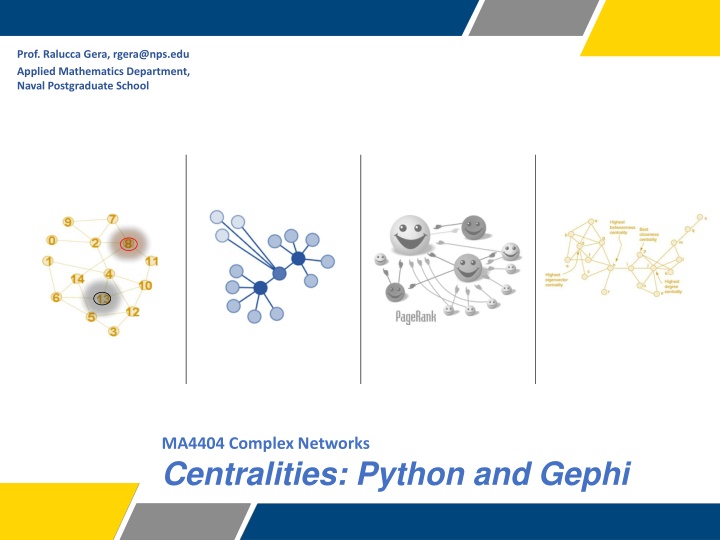
Prof. Ralucca Gera, rgera@nps.edu Applied Mathematics Department, Excellence Through Knowledge Naval Postgraduate School MA4404 Complex Networks Centralities: Python and Gephi
Centralities in Cocalc (Python)
Python code on CoCalc Use NetworkAnalysis.ipynb for each centrality: The default is to show 10 nodes of highest values for each centrality. If you wish to display more than 10 nodes, update the value in the definition of centrality below 3
NetworkX References PDF reference for NetworkX Github interactive version 4
Closeness/Eigenvector The closeness centrality is normalized by dividing by (n-1), where n is the number of nodes in the connected part of graph containing the node. If the graph is not completely connected, this algorithm computes the closeness centrality for each connected part separately. The eigenvector calculation is done by the power iteration method and has no guarantee of convergence. The iteration will stop after max_iter iterations or an error tolerance of number_of_nodes(G)*tol has been reached. For directed graphs this is left eigevector centrality which corresponds to the in-edges in the graph. For out-edges eigenvector centrality first reverse the graph with G.reverse(). https://networkx.github.io/documentation/networkx-1.9/reference/generated/networkx.algorithms.centrality.eigenvector_centrality.html#networkx.algorithms.centrality.eigenvector_centrality 5
Centralities in Gephi ? ??= 1 ?(?,?) ?=1
Resources for Gephi: Overview and explanations of Gephi Gephi s overview tutorial An introductory video to create data for Gephi and to use degree, closeness and betweeness (also posted on the website unde today s lecture). Gephi s overview of layouts Basic navigation
Centralities Click Diameter under the Statistics tab module on the right for Betweenness Closeness The other centralities that available: Eigenvector PageRank HITS For directed graphs, check directed : 8
Ranking nodes based on centralities Once you ran a metric, you can size/color the nodes based on your choices you ran. Under on the top left, choose Nodes, and either size or color 9
Filtering nodes based on centralities Find Filters on the top right, next to Statistics Under topology, you can find the centralities Choose one, drag and drop it to the Queries Choose the bounds needed. 10
Export You can export the visualized graph as SVG or PDF: Go to preview (fix if needed) Resize for large networks Click SVG (SVG is vectorial graphics like PDF so they scale to different sizes nicely) 11
Other metrics Average path length: under the statics module, right Computes the average of shortest paths between all pairs of nodes Result: 12