Advanced Techniques in Work Charting Methods
Explore advanced methods like Pareto Charts and Fishbone Diagrams for analyzing work tasks efficiently. Learn how Flow Diagrams can supplement Process Charts in visualizing complex systems. Dive into Worker and Machine Process Charts to understand time relationships in repetitive work processes.

Download Presentation

Please find below an Image/Link to download the presentation.
The content on the website is provided AS IS for your information and personal use only. It may not be sold, licensed, or shared on other websites without obtaining consent from the author. If you encounter any issues during the download, it is possible that the publisher has removed the file from their server.
You are allowed to download the files provided on this website for personal or commercial use, subject to the condition that they are used lawfully. All files are the property of their respective owners.
The content on the website is provided AS IS for your information and personal use only. It may not be sold, licensed, or shared on other websites without obtaining consent from the author.
E N D
Presentation Transcript
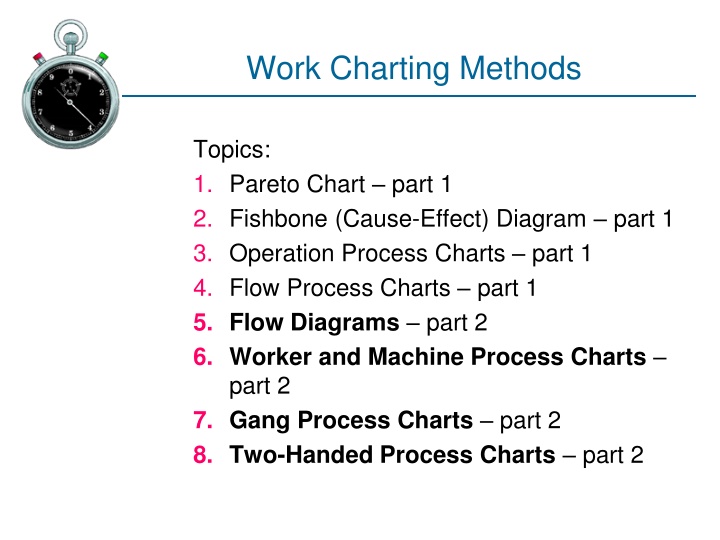
Work Charting Methods Topics: 1. Pareto Chart part 1 2. Fishbone (Cause-Effect) Diagram part 1 3. Operation Process Charts part 1 4. Flow Process Charts part 1 5. Flow Diagrams part 2 6. Worker and Machine Process Charts part 2 7. Gang Process Charts part 2 8. Two-Handed Process Charts part 2
Objectives of Work Charting Methods Objectively document the work task or process for analysis Examine some of many available methods (new ones invented regularly) Break down job into sub-components (tasks) Describe the tasks in a meaningful way
Work Charting Methods 5. Flow Diagrams
5 - Flow Diagrams Diagram in a system representing process flow or set of dynamic relationships Supplement flow process charts Provides overhead pictorial plan of the facility Examples: structure and order a complex system show structure of the elements and their interaction
Work Charting Methods 6. Worker and Machine Process Charts
6 - Worker and Machine Process Charts Show at a single workstation time relationship between: working cycle of a person and operating cycle of a machine(s) Machine times and operator times must be known for each element Chart drawn vertically to scale Useful in describing any repetitive worker- machine system
6 - Worker and Machine Process Charts Solid lines represent: productive time Breaks indicate: idle time Dotted lines represent: non-productive time
Work Charting Methods 7. Gang Process Charts
7 - Gang Process Charts These are Worker and Machine Process charts showing many workers workers are interacting with a piece of equipment or a machine Purpose: determine if interaction between workers is efficient and coordinated Examples: workers at a coal furnace workers in a steel mill
Work Charting Methods 8. Two-Handed Process Charts
8 - Two-Handed Process Charts Left-hand / right-hand chart Operator process chart Flow process chart directed at an operator Each hand is documented separately Activities of worker s hands (or limbs): recorded in their relationship to one another Useful when doing work methods analysis