Agricultural Development: Farm and Food Problems
Delve into the complexities of agricultural development and policy through discussions on farm and food problems, the development paradox, structural transformation, and population growth. Explore the challenges faced in agriculture, policy solutions offered by policymakers, and key readings for deeper insights.

Download Presentation

Please find below an Image/Link to download the presentation.
The content on the website is provided AS IS for your information and personal use only. It may not be sold, licensed, or shared on other websites without obtaining consent from the author.If you encounter any issues during the download, it is possible that the publisher has removed the file from their server.
You are allowed to download the files provided on this website for personal or commercial use, subject to the condition that they are used lawfully. All files are the property of their respective owners.
The content on the website is provided AS IS for your information and personal use only. It may not be sold, licensed, or shared on other websites without obtaining consent from the author.
E N D
Presentation Transcript
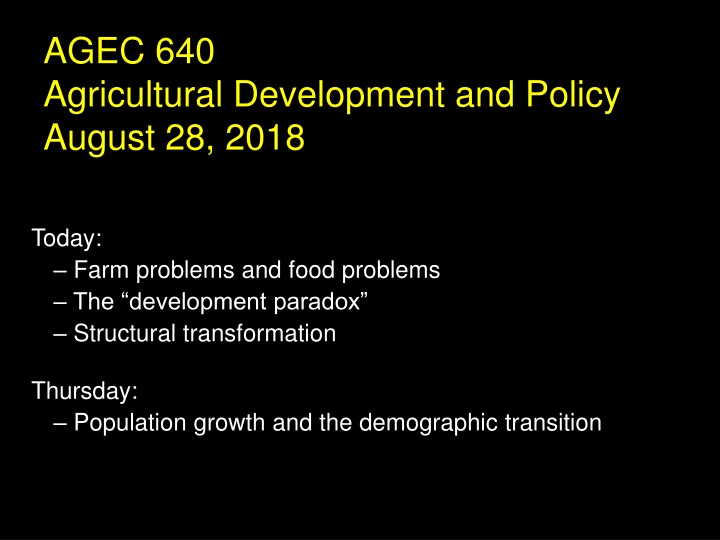
AGEC 640 Agricultural Development and Policy August 28, 2018 Today: Farm problems and food problems The development paradox Structural transformation Thursday: Population growth and the demographic transition
Readings for this week McMillan et al. Globalization, Structural Change, and Productivity Growth, with an Update on Africa World Development. Norton, Alwang & Masters Economic Transformation and Growth. Ch. 5 in Economics of Agricultural Development. Tomich, Kilby and Johnston Poverty and the Rural Economy and Structural Transformation in Transforming Agrarian Economies. Montgomery Notes on the Demographic Transition.
Farm problems and food problems First, some brainstorming: What kinds of problems arise in agriculture? What kinds of solutions do policymakers offer? (recall: USDA Release No. 0181.16)
Where do we see what types of policies? Source: World Bank data, reprinted from UNEP/GRID-Arendal Maps and Graphics Library (http://maps.grida.no/go/graphic/world-bank-country-income-groups).
This is the usual pattern: the development paradox Source: Peter Nicholson of The Australian newspaper (www.nicholsoncartoons.com.au)
When do we see what types of policies? Index of real international food prices, 1900 to 2005 (1977-79 =100) Source: K. Anderson (2006), Reducing Distortions to Agricultural Incentives: Progress, Pitfalls and Prospects. <www.worldbank.org/agdistortions>. Data shown are an index of export prices in US dollars for all major traded agricultural products, deflated by the MUV index which is the unit value of manufactures exported from France, Germany, Japan, UK and US, with weights based on those countries exports to developing countries.
The development paradox in East Asia, 1955-2002 Average Nominal Rate of Protection for Agricultural Production in East Asia, 1955-2002 Negative protection, i.e. taxation Source: K. Anderson (2006), Reducing Distortions to Agricultural Incentives: Progress, Pitfalls and Prospects. <www.worldbank.org/agdistortions>
The development paradox for 68 countries, 1960-2005 All Primary Products Tradables 1.5 Effect of policy on farm product prices, by per-capita income level 1.0 0.5 Above the line: support for agriculture NRA 0.0 Below the line: taxation of agriculture -0.5 $5,000/yr -1.0 6 8 10 6 8 10 Note: Data shown are local polynomial regression lines and 95% confidence intervals through annual national-average Nominal Rate of Assistance (NRA) for 68 countries, covering more than 90% of world agriculture in each year from 1960 through 2005. Income per capita (log) All Primary Products Exportables Importables Source: Masters & Garcia (2009) Agricultural Price Distortion and Stabilization: Stylized Facts and Hypothesis Tests, in K. Anderson, ed., Political Economy of Distortions to Agricultural Incentives. Washington, DC: The World Bank.
The development paradox: employment and earnings Source: Reprinted from World Bank, World Development Report 2008. Washington, DC: The World Bank (www.worldbank.org/wdr2008)
Share of output from agriculture and mining in eight high-income countries, 1860-1960 What happens next? Does the share fall to zero? Source: Reprinted from Tomich, Kilby & Johnston (1995) Transforming Agrarian Economies. Ithaca, NY: Cornell University Press.
The transformation is from agriculture to industry Share of output from industry in eight high-income countries, 1860-1960 but what happens next to industry s share? Source: Reprinted from Tomich, Kilby & Johnston (1995) Transforming Agrarian Economies. Ithaca, NY: Cornell University Press.
over the full span of development, employment shifts to services Percent of workforce by sector in the United States, 1800-2005 today, about 80% of US jobs are in services in 1800, employment was 90% farming in 1930s-70s, industry reached about 40% agricultural employment has stabilized Source: U.S. Economic Report of the President 2007 (www.gpoaccess.gov/eop)
As agricultures share of the economy declines, does farm income also fall? Agricultural Employment as a Share of Civilian Employment and Agricultural Employment as a Share of Civilian Employment and Real Farm Output as a Share of Real GDP Real Farm Output as a Share of Real GDP Until the 1930s, employment and output fell together and then both stopped falling then employment fell much faster than output SOURCE: U.S. Department of Commerce and the Federal Reserve Bank of St. Louis. Reprinted from K.L. Kliesen and W. Poole, 2000. "Agriculture Outcomes and Monetary Policy Actions: Kissin' Cousins?" Federal Reserve Bank of Sf. Louis Review 82 (3): 1-12.
What happens to labor? CARLs: Countries w/ Abundant Rural Labor Reprinted from Tomich, Kilby & Johnston (1995) Transforming Agrarian Economies. Ithaca, NY: Cornell University Press.
As agricultures share of the economy declines, what happens to farm income? Agricultural Employment as a Share of Civilian Agricultural Employment as a Share of Civilian Employment and and Real Farm Output as a Share of Real GDP Real Farm Output as a Share of Real GDP Employment Until the 1930s, employment and output fell together and then both stopped falling then employment fell much faster than output Reprinted from K.L. Kliesen and W. Poole, 2000. "Agriculture Outcomes and Monetary Policy Actions: Kissin Cousins?" Federal Reserve Bank of Sf. Louis Review 82 (3): 1-12.
Another view of structural transformation Peru: ag labor productivity stagnant India: ag labor productivity falling in relative terms France: ag labor productivity increasing in relative terms Source: Figure 6 in McMillan, M. et al. (2014) Globalization, Structural Change, and Productivity Growth, with an Update on Africa. World Development 63: 11-32
The US farm-nonfarm earnings gap, 1910-2000 Source: BL Gardner, 2000. Economic Growth and Low Incomes in Agriculture. AJAE 82(5): 1059-1074.
Structural transformation: the story so far (1) Farming declines as a fraction of the economy, as industry and services grow (2) Farmers incomes decline relative to other workers, but then catch up in the U.S., farmers incomes began to catch up in 1933 farmers incomes passed non-farmers in 1990s (3) What happens within agriculture?
Does total world agricultural output decline? Source: Reprinted from FAO, State of Food and Agriculture 2007. Rome: FAO (www.fao.org)
The structural transformation in world trade: Agriculture s share fell while its total value rose Source: Reprinted from FAO, State of Food and Agriculture 2007. Rome: FAO (www.fao.org)
Does U.S. agricultural output decline? US GDP from Farm and Nonfarm Businesses, 1929-2004 (Billions of 2000 US dollars) 100 10,000 90 9,000 Non-farm business (2000 US$ b.) 80 8,000 Farm value added (2000 US$ b.) 70 7,000 60 6,000 50 5,000 40 4,000 Farm value added (left scale) 30 3,000 20 2,000 Non-farm businesses value added (right scale) 10 1,000 0 0 1930 1935 1940 1945 1950 1955 1960 1965 1970 1975 1980 1985 1990 1995 2000 Source: U.S. Bureau of Economic Analysis, Table 1.3.6 <www.bea.doc.gov>.
What happens to increases in U.S. output? Farm output and agricultural exports in the United States, 1945-2006 280 160 260 140 240 120 220 100 200 80 180 60 160 40 25-30% exported 140 20 Farm market receipts (2000 US$ b.) [left scale] Agric. exports (2000 US$ b.) [right scale] 12-25% exported 120 0 1945 1950 1955 1960 1965 1970 1975 1980 1985 1990 1995 2000 2005 Source: Farm receipts are from US Economic Report of the President 2007 (www.gpoaccess.gov/eop), Table B-97; exports are from USDA, Economic Research Service (www.ers.usda.gov/Data/FATUS). Source: Farm receipts are from US Economic Report of the President 2007 (www.gpoaccess.gov/eop), Table B-97; exports are from USDA, Foreign Agricultural Trade of the United States (www.ers.usda.gov/Data/FATUS). Both converted to constant dollars using GDP deflator. Both are converted to constant dollars using GDP deflator from Bureau of Economic Analysis (www.bea.gov).
Value-added exports grow the most! Fig. 1.3 U.S. Agricultural Exports by Category, 1970-2004 (billions of U.S. dollars) 35 Bulk 30 Intermediate 25 Consumer- Oriented 20 15 10 5 0 1970 Source: USDA, Economic Research Service, Foreign Agricultural Trade of the United States (www.ers.usda.gov/Data/FATUS). 1973 1976 1979 1982 1985 1988 1991 1994 1997 2000 2003
Within agriculture, the structural transformation brings specialization for inputs and marketing Source: Reprinted from World Bank, World Development Report 2008. Washington, DC: The World Bank (www.worldbank.org/wdr2008)
The stylized facts of structural transformation (1) Farming declines as a fraction of the economy, as industry and services grow (2) Farmers incomes decline relative to other workers, but then catch up (3) Within agriculture, row-crop production fluctuates while agro-processing and agribusiness grows but what drives this change? what explains it?
Explaining Structural Transformation Can consumers income growth explain the shift? Engel s law As income grows, demand increases less for food and ag. products than for other things The income-consumption curve for food is relatively flat Income elasticity of demand for food < 1 Bennett s law As income grows, demand increases least for basic staples and rises for higher value foods The income-consumption curve for staples is very flat Income elasticity of demand for staples 0 Evidence for increasing demand for variety
Engels Law for (Global) Food Source: De Hoyos and Lessem (2008) Food Shares in Consumption: New Evidence Using Engel Curves for the Developing World https://mywebspace.wisc.edu/rlessem/web/engel.pdf
Engels Law for food in Vietnam For the poorest group (Q1), meat is a luxury; for the richest (Q5) it is a normal good. For all income groups in Vietnam, rice appears to be a normal good. Source: Le, Canh Quang (2008) An Empirical Study of Food Demand in Vietnam ASEAN Economic Bulletin 25(3): 283-292.
Explaining Structural Transformation Can new technology explain the shift? New farm technology: Cochrane s Treadmill New farm technologies that increase output might lower prices and push farmers out The demand curve for food is relatively steep Food demand is price-inelastic: Price elasticity for food < 1 in absolute value Non-farm technology: bright lights, big city New nonfarm technologies that create opportunities might pull farmers into nonfarm work A Harris-Todaro world? The demand curve for non-food is not as flat as for food Non-food demand is price-elastic Price elasticity for non-food >1 in abs. value
Engels Law for manufactured goods in Malaysia Source: Siddique, M. A. B. (1997) Demand for machinery and manufactured goods in Malaysia Mathematics and Computers in Simulation 43(3-6): 481-486.
Explaining Structural Transformation Limited land area may matter most of all: Because total land area is fixed, farmers savings and investment eventually runs out of uses on the farm, and is applied to other uses farmers earnings are linked to the number of farmers, acres per farmer and earnings per acre As # farmers grows Acres per farmer declines earnings per acre falls and earnings per farmer falls Until what happens ???
Conclusions and the road ahead Ag policies vary widely but show some regularities over time and across countries A key regularity is the development paradox : In poor countries, policies often try to reduce food prices In richer countries, usually switch to raise farm incomes This is closely linked to structural transformation , from farm to non-farm employment and earnings which in turn is closely linked to Thursday s topic: the demographic transition from high to low rates of deaths and births


 Food")