Agricultural Enterprise Gross Margin Analysis England
Explore the gross margin details of different agricultural enterprises in England, including winter wheat, sugar beet, dairy, and pig farming. Analyze outputs, variable costs, and gross margins for each enterprise over specific periods.

Uploaded on | 1 Views
Download Presentation

Please find below an Image/Link to download the presentation.
The content on the website is provided AS IS for your information and personal use only. It may not be sold, licensed, or shared on other websites without obtaining consent from the author. If you encounter any issues during the download, it is possible that the publisher has removed the file from their server.
You are allowed to download the files provided on this website for personal or commercial use, subject to the condition that they are used lawfully. All files are the property of their respective owners.
The content on the website is provided AS IS for your information and personal use only. It may not be sold, licensed, or shared on other websites without obtaining consent from the author.
E N D
Presentation Transcript
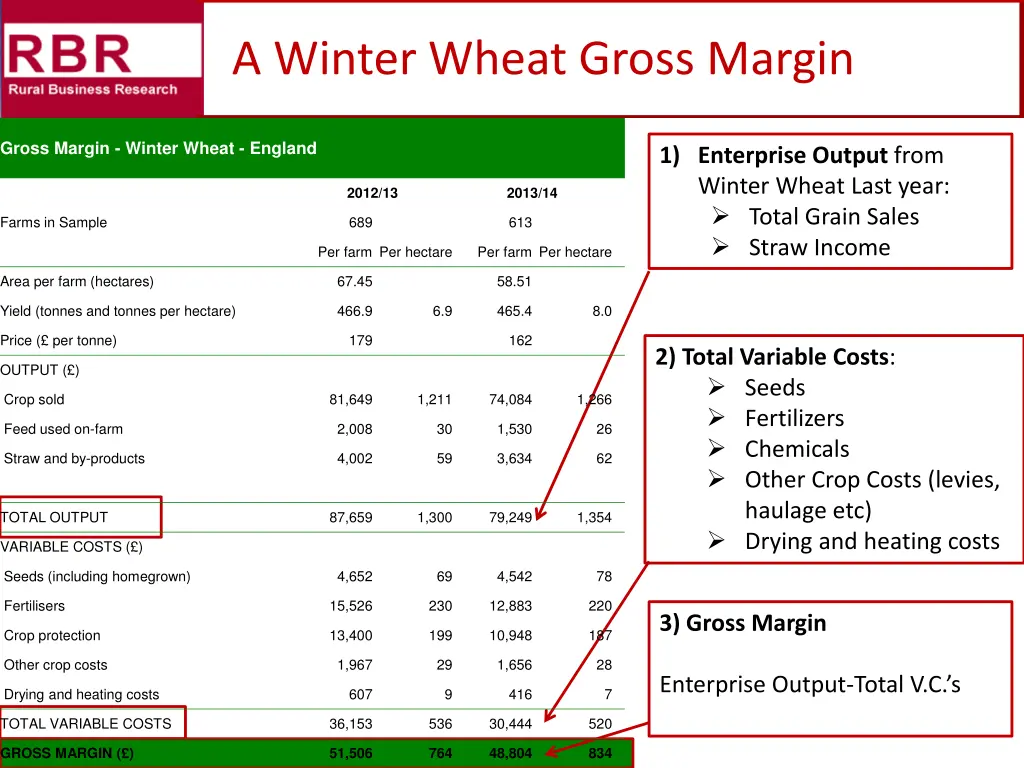
A Winter Wheat Gross Margin Gross Margin - Winter Wheat - England 1) Enterprise Output from Winter Wheat Last year: Total Grain Sales Straw Income 2012/13 2013/14 Farms in Sample 689 613 Per farm Per hectare Per farm Per hectare Area per farm (hectares) 67.45 58.51 Yield (tonnes and tonnes per hectare) 466.9 6.9 465.4 8.0 Price ( per tonne) 179 162 2) Total Variable Costs: Seeds Fertilizers Chemicals Other Crop Costs (levies, haulage etc) Drying and heating costs OUTPUT ( ) Crop sold 81,649 1,211 74,084 1,266 Feed used on-farm 2,008 30 1,530 26 Straw and by-products 4,002 59 3,634 62 TOTAL OUTPUT 87,659 1,300 79,249 1,354 VARIABLE COSTS ( ) Seeds (including homegrown) 4,652 69 4,542 78 Fertilisers 15,526 230 12,883 220 3) Gross Margin Crop protection 13,400 199 10,948 187 Other crop costs 1,967 29 1,656 28 Enterprise Output-Total V.C. s Drying and heating costs 607 9 416 7 TOTAL VARIABLE COSTS 36,153 536 30,444 520 GROSS MARGIN ( ) 51,506 764 48,804 834
A Sugar Beet Gross Margin Gross Margin - Sugar Beet - England Sugar Beet vs. Wheat gross margin 2012/13 2013/14 Farms in Sample 124 124 Per farm Per hectare Per farm Per hectare Area per farm (hectares) 28.40 29.16 1) Higher Yield per Ha Yield (tonnes and tonnes per hectare) 1,704.5 60.0 1,927.5 66.1 Price ( per tonne) 32 33 OUTPUT ( ) 2) Lower Price per tonne Crop sold 53,722 1,891 62,866 2,156 Feed used on-farm 7 0 21 1 3) Higher Output TOTAL OUTPUT 53,729 1,892 62,887 2,157 VARIABLE COSTS ( ) Seeds (including homegrown) 4,808 169 5,338 183 4) Higher Variable Costs, Especially seeds and other crop costs- including levies and haulage Fertilisers 6,695 236 6,987 240 Crop protection 5,742 202 5,760 198 Other crop costs 7,549 266 8,748 300 TOTAL VARIABLE COSTS 24,794 873 26,834 920 GROSS MARGIN ( ) 28,935 1,019 36,054 1,237
A Dairy Gross Margin- Per Cow 1) Enterprise Output calculated per dairy cow Milk Income (price*yield) Calf sales MINUS cost of herd replacement Gross Margin 2012/13 2013/14 Number of cows 162 171 Average Yield (litres) Milk Price (ppl) 7620 28.9 7986 32.4 per cow per cow Milk Calf Herd Replacement 2205 108 -231 2589 114 -229 2) Variable Costs calculated per dairy cow Concentrate feeds Fodder (straw/silage) Vet & Medicines Other livestock costs (haulage, service fees etc) Forage Costs (seeds, ferts, sprays etc) Total Dairy Output 2085 2475 Concentrates Coarse Fodder Vet and medicines Other livestock costs Forage Costs 688 49 81 174 102 768 63 81 183 108 Total variable costs 1094 1203 3) Gross Margin Enterprise Output-Total V.C. s Gross Margin 991 1272
A Pig Gross Margin- Per Sow Gross Margin 2013/14 1) Enterprise Output calculated per breeding sow: Finished pig sales Other Pig related income MINUS herd depreciation/ stock purchases Number of sows 162 Value per sow Finished pig sales Other pig sales Miscellaneous revenue Herd depreciation/ piglet and store purchases 2403 132 1.3 -8 2) Total Variable Costs calculated per breeding sow Other Livestock costs include bedding litter & service fees Total Enterprise Output Concentrates Vet and medicines Other livestock costs Heating Fuel Total variable costs 2528 1498 70 152 2 1721 3) Gross Margin per breeding sow: Total Output Total Variable Costs 4) Whole Enterprise Gross Margin GM per sow* No. Of breeding sows 807*150.4= 121,372.80 Gross Margin 807


