Agricultural Land Experiment Analysis England
Explore a multifactorial experimental design analyzing the impacts of temperature, planting methods, water table levels, and fertilization on biomass, respiration, and ecosystem flux in agricultural land in England. Detailed maps and data visualization included.

Download Presentation

Please find below an Image/Link to download the presentation.
The content on the website is provided AS IS for your information and personal use only. It may not be sold, licensed, or shared on other websites without obtaining consent from the author. If you encounter any issues during the download, it is possible that the publisher has removed the file from their server.
You are allowed to download the files provided on this website for personal or commercial use, subject to the condition that they are used lawfully. All files are the property of their respective owners.
The content on the website is provided AS IS for your information and personal use only. It may not be sold, licensed, or shared on other websites without obtaining consent from the author.
E N D
Presentation Transcript
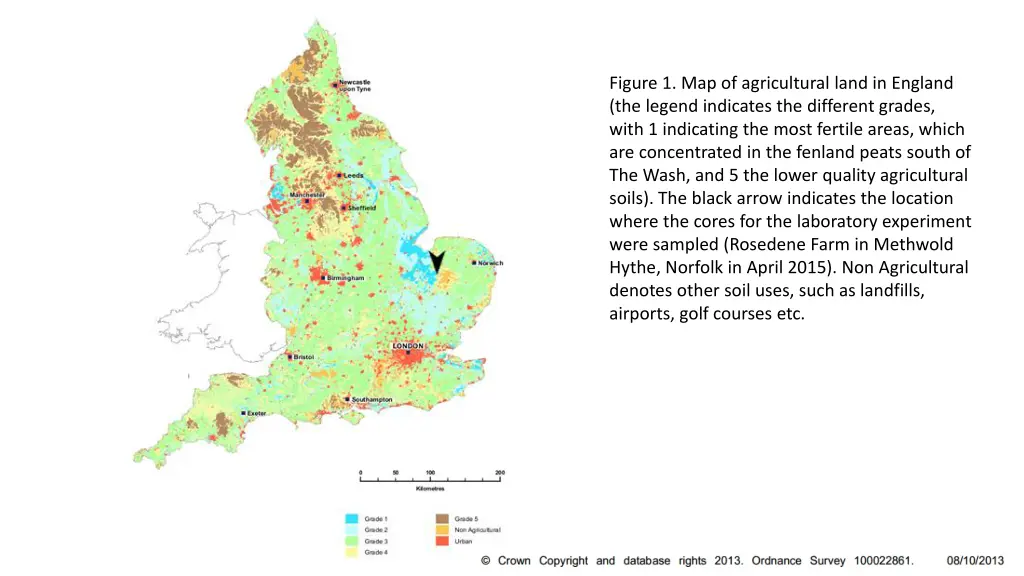
Figure 1. Map of agricultural land in England (the legend indicates the different grades, with 1 indicating the most fertile areas, which are concentrated in the fenland peats south of The Wash, and 5 the lower quality agricultural soils). The black arrow indicates the location where the cores for the laboratory experiment were sampled (Rosedene Farm in Methwold Hythe, Norfolk in April 2015). Non Agricultural denotes other soil uses, such as landfills, airports, golf courses etc.
Not planted Planted Elevated T Fertilised Ambient T Elevated T Not fertilised -50 cm -30 cm -50 cm -30 cm Figure 2. Multifactorial experimental design comprising two temperature treatments (ambient and ambient + 5 C), two planting treatments (planted with celery, not planted), two water table treatments (-30 and -50 cm below the surface) and two fertilisation treatments (fertilised and not fertilised).
Figure 3. The transparent headspace chamber for gas flux used for the CO2 and CH4 concentration measurements from plants and soil under controlled lighting conditions (e.g. net ecosystem exchange).
a) b) c) -50 cm -50 cm -30 cm -30 cm -50 cm -30 cm Shoots Roots -30 cm Fertilised Ambient -30 cm Fertilised Elevated -30 cm Not Fertilised Ambient -30 cm Not Fertilised Elevated -50 cm Fertilised Ambient -50 cm Fertilised Elevated -50 cm Not Fertilised Ambient -50 cm Not Fertilised Elevated Figure 4. Biomass of shoots (leaves and stems, in black) and Roots (in red) a) when fresh and b) oven dried, and c) dry root:shoot dry weight ratio sampled at the end of the experiment. The water table was kept at either -30 cm or -50 cm (as indicated in the x-axis), and air temperatures at ambient or ambient +5 C, and half the peat cores received fertilizer. Displayed values are means and standard errors (n=4).
a) c) Figure 5. Mean respiration averaged over 11 weeks for a) soil (Rh) b) NEE; c) ecosystem respiration (ER) together with d) GPP over the same time period. In each case the water table was kept at -30 cm or - 50 cm, and air temperatures at ambient or ambient +5 C, and half the peat cores received fertilizer. Displayed values are means and standard errors (n=4). b) d) -30 cm Fertilised Ambient -30 cm Not Fertilised Ambient -50 cm Fertilised Ambient -50 cm Not Fertilised Ambient -30 cm Fertilised Elevated -30 cm Not Fertilised Elevated -50 cm Fertilised Elevated -50 cm Not Fertilised Elevated -50 cm -30 cm -50 cm -30 cm
a) b) -30 cm -30 cm -50 cm -50 cm -30 cm Fertilised Ambient -30 cm Not Fertilised Ambient -50 cm Fertilised Ambient -50 cm Not Fertilised Ambient -30 cm Fertilised Elevated -30 cm Not Fertilised Elevated -50 cm Fertilised Elevated -50 cm Not Fertilised Elevated Figure 6. Average CH4flux over a period of 11 weeks from a) not planted, b) planted cores with water table kept at -30 cm or -50 cm and with ambient air temperatures or +5 C air temperature, in cores with and without fertilizer additions. Displayed values are means and standard errors (n=4).


")
")
")