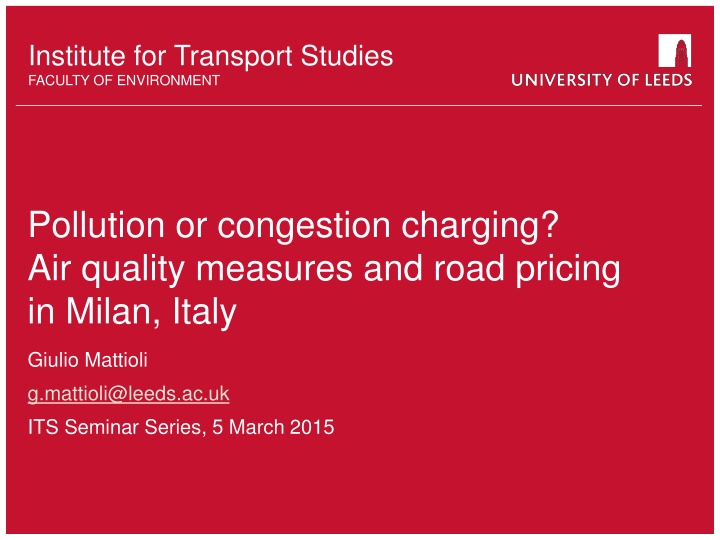
Air Quality Measures and Road Pricing in Milan, Italy
Milan's experience with pollution and congestion charging, including the high acceptability of road pricing in the city. The presentation explores the use of air quality evidence in policy debates and the background information of Milan's transportation system.

Download Presentation

Please find below an Image/Link to download the presentation.
The content on the website is provided AS IS for your information and personal use only. It may not be sold, licensed, or shared on other websites without obtaining consent from the author.If you encounter any issues during the download, it is possible that the publisher has removed the file from their server.
You are allowed to download the files provided on this website for personal or commercial use, subject to the condition that they are used lawfully. All files are the property of their respective owners.
The content on the website is provided AS IS for your information and personal use only. It may not be sold, licensed, or shared on other websites without obtaining consent from the author.
E N D
Presentation Transcript
School of something FACULTY OF OTHER FACULTY OF ENVIRONMENT Institute for Transport Studies Pollution or congestion charging? Air quality measures and road pricing in Milan, Italy Giulio Mattioli g.mattioli@leeds.ac.uk ITS Seminar Series, 5 March 2015
Urban road pricing referenda (EU) % Yeas Edinburgh (2005): 26% Manchester (2008): 21% Gothenburg (2014): 43% Stockholm (2007): 51% Milan (2011): 79% more vehicles charged increased charge extension of charging area
Milans experience with charging More exceptional features: framed in the contest of air quality concerns introduced by right-of-the-centre city government (local) press very supportive of charging referendum promoted by environmental association pollution charging turned into congestion charging still little known internationally OECD International Transport Forum Award 2014
Case study Reasons of interest: challenge assumption of unacceptability of road pricing use of air quality evidence in policy debate on charging EC launching legal action against UK over air quality (2014) Ultra Low Emission Zone in London Growing interest for transport - city politics link (Walks, 2015) Approach literature review on public acceptability of road pricing desk research (official reports, local press articles, 2008-2012) quantitative analysis of electoral + census data
Structure of the presentation 1. Milan: background information 2. Pollution & congestion charging 2000-present 3. 2011 referendum: reasons for high acceptability 4. The use of air quality measures in the policy debate
Italian metropolitan areas Source: Boffi, Colleoni & Palvarini, 2013, based on Italian Census 2001
Milan metropolitan area Source: Boffi & Palvarini, 2011, based on Italian Census 2001
Milan: transport Italy - highest EU motorisation rate after Luxembourg: 62.1 passenger cars / 100 inhabitants Milan: 51.8 cars /100 in. (EU cities median=43.6) car modal share: 39%; PT: 43% (trips within city proper) among the cities with the highest car concentration in the world (Rotaris et al. 2010) Illegal parking rate: 46% Tom Tom European Traffic Index 2013: 24th (2011: 11th) Inrix Traffic Scorecard 2014: 1st (2010: 4th)
Milan: transport Picture: Stefano Agretti
Adverse geo-climatic conditions Po Valley: almost enclosed basin (2,000-4,000m mountain range) Average wind speed: 0.9 m/sec. EU cities average: 2.5 m/sec Temperature inversion in winter Source: Earth observatory NASA
Air quality (2012) European Environmental Agency Air Quality in Europe 2014 Report: Concentrations of PM10 PM2.5: high levels (in exceedance of annual target values) in the Po Valley High values also for O3, NO2, BaP, CO
School of something FACULTY OF OTHER Chronology of events Period Mayor Events 2001-2006 Albertini (right) Road pricing debated Ecopass (pollution charge) in the making 2006-2008 Moratti (right) 2008 Ecopass implemented 2009-2011 Ecopass in question Mayoral elections + referendum on extension Area C (congestion charge) implemented Extension of charging area discussed 2011 2012 Pisapia (left) 2012-
1999-2008 1999/2002: EU Directive limit values for PM10 (with effect from 2005) daily: 50 g/m3, for not more than 35 days per year; Calendar year average: 40 g/m3 2006: Edoardo Croci (Prof. Environmental Economics) Transport, Mobility and Environment Local Councillor 2006: working group (academics / city officials) on cordon pricing 2008: Ecopass introduced 2009: Croci forced to resign 2010: MilanosiMuove initiative 2011: Referendum on upgrade & extension
Ecopass (2008-2011) Class Main vehicle category Char ge ( ) 1 Low Emission Vehicles 0 2 Petrol Euro 3-4, Diesel 4 with particulate filter 0 3 Petrol Euro 1-2 2 4 Petrol Euro 0 + other diesel 5 5 Diesel cars Euro 0 + Diese commercial vehicles Euro 0- 2 10 Source: ICLEI, 2013 ANPR technology Mon-Fi, 7:30-19:30 Discounts for frequent users & residents Part of package including PT improvements aims, monitoring and communication focused on pollution deliberate foot in the door strategy?
Charging area historical city centre , area within 16th century city walls small: 8.2km2, 4.5% of municipality (London: 22km2, Stockholm: 47 km2) but massive concentration of employment / population density during the day (central business district) concentration of households with high socio-economic status in the area
Ecopass: results Vehicle access to the charging zone: drastic drop in 2008 (-21%), then increase (but still -16.2 by 2011) rapid increase in the share of exempted vehicles (2007: 50%; 2008: 75%; 2010: 90%) fleet renewal PM10levels: estimated reduction of emissions produced within the area: -15% (2008) difficult to discern effects on measures of monitoring stations 2009: first European city to reach the threshold of 35 days; 2011: the 35-day threshold is reached by 7th February (worst result since 2006) Ruprecht et al. (2008): no significant difference in PM levels between Ecopass area and outside heated public debate on failure of Ecopass
Area C (2012-present) Pricing scheme: Daily: 5 Exempted: motorcycles and scooters, EVs & hybrid, natural gas, LPG and bi-fuel vehicles (until end 2016) Forbidden vehicles: Euro 0 petrol, Euro 0, 1, 2, 3 diesel, >7.5 meters Registered resident 2-3 Multiple daily tickets (30 & 60 ) Combined Area C + Garage initiative Mon, Tu, We, Fri: 7.30-19.30; Thu: 7.30-18 part of package with investment in modal alternatives, etc.
Area C: results (2012-2014) Vehicle access to CA: -28%/-31% (base: 2011) Modal shift to PT (+4% trips in 2012 over whole city) but also motorbikes -26% road accidents in CA Increased speed for tramways (+4%) and buses (+7%) Revenue (2012): 11.2 million (operational costs: 6.5 million ) Modelled reductions in emissions produced within CA: PM10 source (- 10%); PM10 tot (-18%); NH3 (-42%); Nox (-18%); CO2 (-35%)
2011 Referendum: reasons for high acceptability 1. Wording on the ballot-papers 2. Simultaneity with other local & national referenda 3. Vote driven by political motives 4. Small charging area Framing in terms of air quality (rather than congestion) 5.
1. Wording on the ballot-paper Comprehensive strategy - goals: Doubling of pedestrian areas by 2012 ..to be financed with new congestion charge (5-10 ) for all vehicles + gradual extension of the area to outer ring Doubling of 30km/h areas by 2012 Bike lanes network of 300km by 2015 Protection of all Bus lanes by 2015 Goal: -50% traffic, -50% polluting emissions Introduction of neighbourhood bus service Extension of bike sharing / car sharing services Subway service during the night Improving of taxi services
1. Simultaneity with other referenda School of something FACULTY OF OTHER (12-13 June 2011) Referendum Yeas (%) Voter turnout (%) Item-test correlation Traffic & pollution 79 49 0.93 Public green space 96 49 0.98 Local (citizen s initiative) Expo 96 49 0.98 Energy efficiency 95 49 0.98 City canals 94 49 0.98 Water privatisation 92 52 0.97 Water tariffs 93 52 0.97 National (abrogative) Nuclear 92 52 0.97 Legitimate impediment 94 52 0.97
3. Referendum results Congestion Charing: % of Yeas (on valid votes) Source: own elaboration on electoral data
3. Referendum results Congestion Charing: % of Yeas (on registered electors) Source: own elaboration on electoral data
3. Referendum results Source: own elaboration on electoral data + census data
3. Referendum results Source: own elaboration on electoral data + census data
4. Small charging area Current area: 8km2, 4.5% of municipality (still in 2015) But referendum demand extension to larger road ring area: 29km2, 15.7% of municipality
Use of air quality evidence Ecopass (2008-2011) Supporters: Health impacts emphasised/exaggerated Scheme presented as a work in progress (or a foot in the door?) Both high and low PM levels are used to support upgrade/extension Opponents: Ecopass as a failed experiment (because of high PM) But proposed alternatives are even more radical: close to traffic entirely (at least part of) the city centre; traffic restrictions based on alternate number plates day (during periods of environmental emergency ) Need for some form of traffic restriction not questioned
Use of air quality evidence Area C(2012-present) Supporters: Attempt to decouple congestion charging from pollution. New goals: traffic reduction, quality of urban environment still seizing every available piece of evidence to suggest impact on air pollution / health risk reduction Launched Black Carbon (BC) monitoring project (2012) Opponents: Remind high levels of PM / breach of EU limits Question the legitimacy of BC as an indicator of health risk Accuse city government of making instrumental use evidence / push forward hidden anti-car agenda Failed to gather enough signatures for a referendum
Black Carbon WHO (2012): better indicator of harmful particulate substances from combustion sources (especially traffic) than PM (at least for short-term health effects) within-city variability is greater than for PM mass, particularly in relation to traffic health effects of traffic limitation policies may be seriously underestimated when based on effects estimates for PM2.5 or PM10 Climate forcing agent
Black Carbon Invernizzi et al. (2011): Traffic restrictions are an unpopular tool to mitigate urban air pollution, and a measurable improvement in air quality is needed to demonstrate the effectiveness of this measure. Previous attempts failed to detect measurable reductions of PM mass pollution within the areas subject to traffic restriction. However, black carbon, which is emitted primarily by traffic sources, could be a PM metric more suitable to demonstrate pollutant reductions BC monitoring report (2012): -28/-40% BC in the charging area (as compared to outside) -75%/-78% on carfree sundays (as compared to normal Sunday) no significant within-city variation in PM strong correlation between traffic levels and BC
Latest developments Municipality - Sustainable Urban Mobility Plan (2015) extension of charging area postponed: double cordon-pricing (2.5 each) to be implemented in the long term (2022?) Back to pollution charging? Low Emission Zone MilanosiMuove promoting online petition for extension of charging area and reduction of exemptions / discounts EU introducing BC as additional measure? or scrapping air quality directive completely?
Milan LEZ among the projects of the new Sustainable Urban Mobility plan ANPR-based (100 gates) 136 km2 75% of municipality access rules to be defined
Conclusions: Public and political acceptability EU air quality directives opened a window of opportunity for political entrepreneurs aiming to limit car use in Milan Framing of pricing debate in terms of air quality / health undermines legitimacy of outright opposition The terrain of conflict is often the use of air quality evidence All actors: opportunistic use of evidence. Use air quality measures that conform to their agenda Referendum results can be strongly influenced by wider political dynamics, especially when paired with other elections (cfr. Gothenburg)
Links (in English) www.comune.milano.it/areac Mattioli G; Boffi M; Colleoni M (2012) Milan s pollution charge: sustainable transport and the politics of evidence (online conference paper) ICLEI, 2013, The Ecopass pollution charge and Area C congestion charge, comparing experiences with cordon pricing over time
School of something FACULTY OF OTHER FACULTY OF ENVIRONMENT Institute for Transport Studies Thank you for your attention Giulio Mattioli g.mattioli@leeds.ac.uk

")


")


")


")
")


")