Algorithm for Contraceptive Implants
Forecasting algorithm for ECP based on morbidity and demographic factors, estimating the total population of WRA, CPR rates for modern methods, contraception failure rates, unmet contraception needs, and more. Also includes a forecasting algorithm for contraceptive implants, covering total population, users of contraceptive implants, distribution by public and SM sectors, types of implants used, and user insertion needs.

Download Presentation

Please find below an Image/Link to download the presentation.
The content on the website is provided AS IS for your information and personal use only. It may not be sold, licensed, or shared on other websites without obtaining consent from the author. If you encounter any issues during the download, it is possible that the publisher has removed the file from their server.
You are allowed to download the files provided on this website for personal or commercial use, subject to the condition that they are used lawfully. All files are the property of their respective owners.
The content on the website is provided AS IS for your information and personal use only. It may not be sold, licensed, or shared on other websites without obtaining consent from the author.
E N D
Presentation Transcript
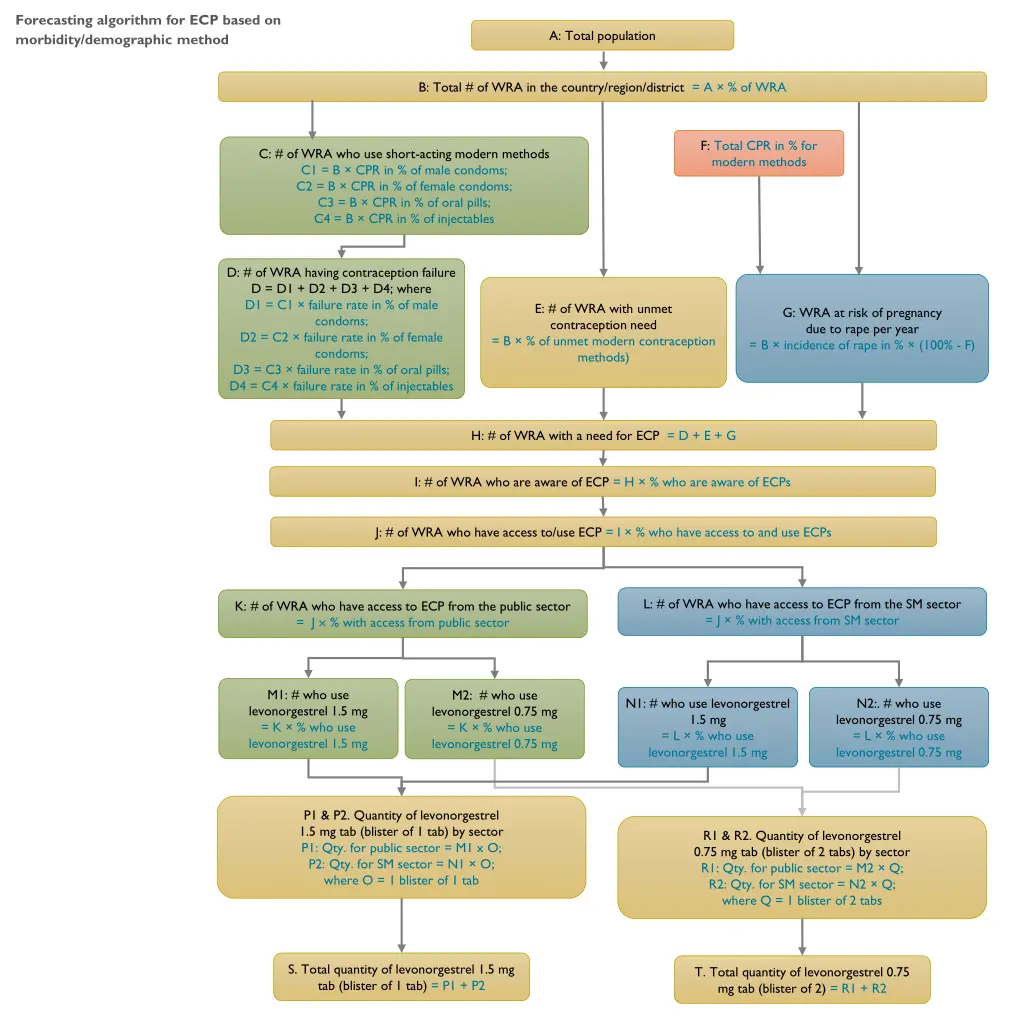
Forecasting algorithm for ECP based on morbidity/demographic method A: Total population B: Total # of WRA in the country/region/district = A % of WRA F: Total CPR in % for modern methods C: # of WRA who use short-acting modern methods C1 = B CPR in % of male condoms; C2 = B CPR in % of female condoms; C3 = B CPR in % of oral pills; C4 = B CPR in % of injectables D: # of WRA having contraception failure D = D1 + D2 + D3 + D4; where D1 = C1 failure rate in % of male condoms; D2 = C2 failure rate in % of female condoms; D3 = C3 failure rate in % of oral pills; D4 = C4 failure rate in % of injectables E: # of WRA with unmet contraception need = B % of unmet modern contraception methods) G: WRA at risk of pregnancy due to rape per year = B incidence of rape in % (100% - F) H: # of WRA with a need for ECP = D + E + G I: # of WRA who are aware of ECP = H % who are aware of ECPs J: # of WRA who have access to/use ECP = I % who have access to and use ECPs L: # of WRA who have access to ECP from the SM sector = J % with access from SM sector K: # of WRA who have access to ECP from the public sector = J % with access from public sector M1: # who use levonorgestrel 1.5 mg = K % who use levonorgestrel 1.5 mg M2: # who use levonorgestrel 0.75 mg = K % who use levonorgestrel 0.75 mg N1: # who use levonorgestrel 1.5 mg = L % who use levonorgestrel 1.5 mg N2:. # who use levonorgestrel 0.75 mg = L % who use levonorgestrel 0.75 mg P1 & P2. Quantity of levonorgestrel 1.5 mg tab (blister of 1 tab) by sector P1: Qty. for public sector = M1 x O; P2: Qty. for SM sector = N1 O; where O = 1 blister of 1 tab R1 & R2. Quantity of levonorgestrel 0.75 mg tab (blister of 2 tabs) by sector R1: Qty. for public sector = M2 Q; R2: Qty. for SM sector = N2 Q; where Q = 1 blister of 2 tabs S. Total quantity of levonorgestrel 1.5 mg tab (blister of 1 tab) = P1 + P2 T. Total quantity of levonorgestrel 0.75 mg tab (blister of 2) = R1 + R2
Forecasting algorithm for contraceptive implants based on morbidity/demographic method A: Total population B: Total # of WRA in the country/region/district = A % of WRA C: Total # of WRA who use contraceptive implants = B CPR in % for contraceptive implants D: # of public sector contraceptive implant users = C % users from public sector E: # of SM sector contraceptive implant users = C % users from SM sector F: # of public sector implant users by type/brand F1: Levonorgestrel 75 mg/rod: 2-rod-5 year = D % who use 2-rod 5-year type F2: Levonorgestrel 75 mg/rod: 2-rod 3-year = D % who use 2-rod 3-year type F3: Levonorgestrel 68 mg/rod: 1-rod 3-year = D % who use 1-rod 3-year type G: # of SM sector implant users by type/brand G1: Levonorgestrel 75 mg/rod: 2-rod 5-year = E % who use 2-rod 5-year type G2: Levonorgestrel 75 mg/rod: 2-rod 3-year = E % who use 2-rod 3-year type G3: Levonorgestrel 68 mg/rod: 1-rod 3-year = E % who use 1-rod 3-year type H: # of users who need insertion of implants in the public sector by type/brand in each year = (F users in the previous year) + (number of users who discontinue use during the current year*)]; where J: # of users who need insertion of implants in the SM sector by type/brand in each year = (G users in the previous year) + (number of users who discontinue use during the current year*)]; where # of users who discontinue use in current year = # of users in the previous year x discontinuation rate (%) Example: H1: # that need insertion of Levonorgestrel 75 mg/rod, 2-rod 5-year = (F1 users in the previous year) + (# of users in the previous year x discontinuation rate in %) # of users who discontinue use in current year = # of users in the previous year x discontinuation rate (%) Example: J1: # that need insertion of Levonorgestrel 75 mg/rod, 2-rod 5-year = (G1 users in the previous year) + (# of users in the previous year x discontinuation rate in %) K: Quantity of each brand/type needed in the public and SM sector K1: Levonorgestrel 75 mg/rod, 2-rod 5-year = H1 + J1 K2: Levonorgestrel 75 mg/rod, 2-rod 3-year = H2 + J2 K3: Levonorgestrel 68 mg/rod, 1-rod 3-year = H3 + J3
Forecasting algorithm for female condoms based on morbidity/demographic method A: Total population B: Total # of women 15-59 years in the country/region/district = A % of 15-59 years of age C: # of sexually active women 15-59 years, excluding CSWs = B % sexually active women 15-59 years D: # of CSWs = B % CSWs E: # of sexually active women 15-59 years, excluding CSWs with a need for female condoms = C % sexually active women 15-59 years with a need for female condoms F: # of CSWs with a need for female condoms = D % CSWs with a need for female condoms G: # of sexually active women 15-59 years, excluding CSWs, who are aware of female condoms = E % who are aware of female condoms H. # of CSWs who are aware of female condoms = F % who are aware of female condoms I: # of sexually active women 15-59 years, excluding CSWs, who are aware of and use female condoms = G % who are aware of and use female condoms J: # of CSWs who are aware of and use female condoms = H % who are aware of and use female condoms L: # of CSWs who have access to female condoms by sector L1: Public sector = J % with access from public sector L2: SM sector = J % with access from SM sector K: # of sexually active women 15-59 years, excluding CSWs, who have access to female condoms by sector K1: Public sector = I % with access from public sector K2: SM sector = I % with access from SM sector N: # of female condoms required by sexually active women 15- 59 years, excluding CSWs, by sector N1: public sector = K1 M; N2: SM sector = K2 M; where M = CYP = # of female condoms per women per year = 120 P: # of female condoms required by CSWs by sector P1: public sector = L1 O; P2: SM sector = L2 O; where O = CYP = # of female condoms per CSW per year = 120 Q: Quantity of female condoms required for each sector Q1: Qty needed for Public sector = N1 + P1 Q2: Qty needed for Social marketing sector = N2 + P2 R: Total # of female condoms required per year (public and SM sectors) = Q1 + Q2
Forecasting algorithm for medicines used for prevention of PPH based on morbidity method A: Total population B: Total pregnancies = A % of pregnancies C: Total deliveries = B [100% - miscarriage rate (%)] D: # of public HF deliveries = C % of deliveries in public HFs G: # of home deliveries = C % of deliveries at home E: # of public HF deliveries provided with prevention for PPH = D % provided with prevention for PPH F: # of public HF deliveries provided with a specific uterotonic for prevention of PPH = E % to be given specific uterotonic for PPH prevention F1: # provided oxytocin = E x % given oxytocin F2: # provided HSC = E x % given HSC F3: # provided misoprostol = E x % given misoprostol H: # of home deliveries provided with prevention (misoprostol) for PPH = G % provided with misoprostol for PPH prevention J: Qty. of each uterotonic required for the public HFs = F I; J1 = F1 I1; J2 = F2 I2; J3 = F3 I3; K: Qty. of each uterotonic required for home deliveries = H I; K = H I3 where I = average quantity of each uterotonic per case I1: oxytocin 10 IU amp = 1 amp; I2: HSC 100 mcg amp = 1 amp; I3: misoprostol 200 mcg tab = 3 tabs where I = average quantity of each uterotonic per case I3: misoprostol 200 mcg tab = 3 tabs; L: Total qty. of each medicine needed for prevention of PPH (public HF + home) = Qty. of each uterotonic required for public HF deliveries + qty. of each uterotonic required for home deliveries L1: quantity of oxytocin needed = J1 L2: quantity of HSC needed = J2 L3: quantity of misoprostol needed = J3 + K
Forecasting algorithm for medicines used for treatment of PPH based on morbidity method A: Total population B: Total pregnancies = A % of pregnancies C: Total deliveries = B [100% - miscarriage rate (%)] D: # of public HF deliveries = C % of deliveries in public HFs G: # of home deliveries = C % of deliveries at home E: # of public HF deliveries provided with prevention for PPH = D % provided with prevention for PPH M: # of public HF deliveries NOT provided with prevention for PPH = D % NOT provided with prevention for PPH H: # of home deliveries provided with prevention for PPH = G % provided with prevention for PPH Q: # of home deliveries NOT provided with prevention for PPH = G % NOT provided with prevention for PPH N: # of public HF deliveries that develop PPH after prevention = E incidence of PPH after prevention O: # of public HF deliveries that develop PPH without prevention = M incidence of PPH without prevention R: # of home deliveries that develop PPH after prevention = H incidence of PPH after prevention S: # of home deliveries that develop PPH without prevention = Q incidence of PPH without prevention T: # of home PPH cases referred to public HFs = (R + S) % referred to public HFs for treatment P: # of public HF PPH cases treated = (N + O) % treated at public HFs U: # of home PPH cases treated at public HFs = T % treated at public HFs V: # of PPH cases treated with a specific medicine/regimen = (P + U) % to be given specific medicine for PPH treatment V1 = (P + U) % treated with oxytocin, OR V2 = (P + U) % treated with misoprostol AND V3 = (P + U) % treated with TXA X: Qty. of each medicine required to treat PPH cases = # of PPH cases treated with each medicine by group V; X1 = V1 W1; OR X2 = V2 W2; AND X3 = V3 W3; Where, W = average quantity of each medicine per case W1= 4 amps of oxytocin 10 IU amp, OR W2 = 4 tablets of misoprostol 200 mcg; AND W3 = 1 amp of TXA 1 g
Forecasting algorithm for single use calibrated drapes used for diagnosis of PPH based on morbidity method A. Total population B. Total pregnancies (Total population % of pregnancies) C. Total deliveries {Pregnancies [100% - miscarriage rate (%)]} D. # of public HF deliveries = C % of deliveries in public HFs E. # of public HF non-CS or Vaginal deliveries = D % vaginal deliveries at public HFs F. # of public HF vaginal deliveries provided with calibrated drapes for PPH diagnosis = E % provided with calibrated drapes H. Quantity of disposable calibrated drapes needed at public HFs H = F G Where G = quantity of calibrated drapes per case (1 per case for single use drapes)
Forecasting algorithm for medicines used for acute treatment of severe hypertension in pregnancy based on morbidity method A: Total population B: Total pregnancies = A x % of pregnancies C: # of pregnancies with severe hypertension = B x Incidence of severe hypertension D: # of pregnancies with severe hypertension identified at public HFs = C x % of cases identified at public health facilities F: # of pregnancies with severe hypertension: public hospitals = D x % identified at public hospitals E: # of pregnancies with severe hypertension at 1st level public HFs = D x % identified at 1st level public HFs H: # of severe hypertensive cases treated: public hospitals = F x % treated with antihypertensives G: # of severe hypertensive cases treated at 1st level public HFs = E x % treated with antihypertensives J: # of public hospital severe hypertensive cases treated with specific regimens J1: # treated with methyldopa = H x % treated with methyldopa J2: # treated with labetalol = H x % treated with labetalol J3: # treated with hydralazine = H x % treated with hydralazine Plus other regimens I: # of 1st level public HF severe hypertensive cases treated with specific regimens I1: # treated with methyldopa = G x % treated with methyldopa I2: # treated with labetalol = G x % treated with the labetalol Plus other regimens N: Quantity of each medicine required in public hospitals N1: Quantity of methyldopa 250mg tab = J1 x % treated x M1; where M1: quantity per case = 36 tabs N2a: Quantity of labetalol 200mg tab = J2 x % treated x M; where M2a: quantity per case =18 tabs N2b: Quantity of labetalol 20mg/2ml sol. for inj. in amp = J2 x % treated x M2b; where M2b = quantity per case = 45 amps N3: Quantity of hydralazine20mg powder for inj. in 2ml vials = J3 x % treated x M3; where M3: quantity per case = 3 vials Plus other regimens* L: Quantity of each medicine required at 1st level public HF L1: Quantity of methyldopa 250mg tab = I1 x % treated x K; where K1: quantity per case =36 tabs L2: Quantity of labetalol 200mg tab = I2 x % treated x K2; where K2: quantity per case = 18 tabs Plus other medicines* O. Quantity of each medicine required to treat severe hypertension in pregnancies in the public sector O1: Quantity of methyldopa 250mg tab = L1 + N1; O2: Quantity of labetalol 200mg tab = L2 + N2a; O3: Quantity of labetalol 20mg/2ml sol. for inj. in amp = N2b; O4: Quantity of hydralazine 20mg powder for inj. in 2ml vial = N3; Plus other medicines*
Forecasting algorithm for MgSO4 used for prophylaxis and treatment of eclampsia based on morbidity method A: Total population B: Total pregnancies = Total population % of pregnancies L: No. of home pregnancies = B x % of home pregnancies C: # of pregnancies at public HFs = B % of pregnancies attending ANC in public HFs D: # of pre-eclampsia cases at public HFs = C incidence of pre-eclampsia E: # of public HF pregnancies with severe pre-eclampsia = D x incidence of severe pre-eclampsia J: # of public HF severe pre-eclampsia cases not given MgSO4 for prophylaxis that develop eclampsia = (E-F)x Incidence of eclampsia without prophylaxis F: # of severe pre-eclampsia cases given MgSO4 for prophylaxis of eclampsia = E % given MgSO4 for prophylaxis of eclampsia M: No. of home pregnancies with eclampsia = L x Incidence of eclampsia H: Quantity of MgSO4 required for prophylaxis of eclampsia H = F G; where G = 9 ampoules of MgSO4 5 g/10 ml*; OR 44 ampoules of MgSO4 1 g/2 ml* I: # of public HF severe pre- eclampsia cases that develop eclampsia after prophylaxis = F x Incidence of eclampsia after prophylaxis N: # of home pregnancies with eclampsia that are referred to public HFs = M x % referred to public HFs K: # of public HF eclampsia cases treated with MgSO4 = (I+J) x % treated O: # of eclampsia cases treated at public HFs = N x % treated Q: Quantity of MgSO4 required for treatment of eclampsia = (K+O) x P; where P : quantity per case = 9 ampoules of MgSO4 5g/10ml*; OR 44 ampoules of MgSO4 1g/2ml* R. Total quantity of MgSO4 required for prophylaxis and treatment of eclampsia = H + Q *All cases are assumed to be given MgSO4 only either for the prevention and treatment of eclampsia, according to WHO s recommendation; and other anticonvulsants such as diazepam are not used.
Forecasting algorithm for MgSO4 used for prophylaxis and treatment of eclampsia based on allocations by facility type A: # of public HFs by type where MgSO4 is supposed to be used for prevention and treatment of eclampsia A1: Referral hospitals; A2: Regional hospitals; A3: District hospitals; A4: Health centers; Plus other health facilities* C: Quantity of MgSO4 5 g/10 ml; or MgSO4 1 g/2 ml ampoules needed per year per facility type C1: quantity for referral hospitals = A1 x B1; where B1 = average quantity per referral hospital per year C2: quantity for regional hospitals = A2 x B2; where B2 = average quantity per regional hospital per year C3: quantity district hospitals = A3 x B3; where B3 = average quantity per district hospital per year C4: quantity for health centers = A4 x B4; where B4 = average quantity per health center per year Plus quantity for other health facilities* D: Total quantity of MgSO4 5 g/10 ml; or MgSO4 1 g/2 ml ampoules needed per year = C1 + C2 + C3 + C4 + Notes: - Average quantity of allocation per facility level per year shall consider: the incidence of the cases by level, capacity to administer the products ( for example health center may be allowed to administer the loading/pre-referral dose only) and the minimum possible pack size for distribution to health facilities. * consider other health facility types, or sub-groups of the ones indicated above, and medicines as applicable to the local context - Once MgSO4 and calcium gluconate are distributed based on the allocation, the morbidity method can be used to estimate actual demand and replenish what is used during each year of the quantification period; expiry dates should be considered, though. Alternatively, the quantification team may use a combination of the two methods of forecasting, applying the allocation methods for the health facilities where the number of cases is estimated to be low (such as health centers) and applying the morbidity method for those health facility types that have relatively high incidence of cases that allows smooth distribution of the medicines considering the lowest distribution pack sizes. -
Forecasting algorithm for calcium gluconate used to treat toxicity of MgSO4 based on allocations by facility type A: # of public HFs by type where MgSO4 is supposed to be used for prevention and treatment of eclampsia A1: Referral hospitals; A2: Regional hospitals; A3: District hospitals; A4: Health centers; Plus other health facilities* C: Quantity of calcium gluconate 1g/10ml, ampoules needed per year per facility type C1: quantity for referral hospitals = A1 x B1; where B1 = average quantity per referral hospital per year C2: quantity for regional hospitals = A2 x B2; where B2 = average quantity per regional hospital per year C3: quantity for district hospitals = A3 x B3; where B3 = average quantity per district hospital per year C4: quantity for health centers = A4 x B4; where B4 = average quantity per health center per year Plus quantity for other health facilities* D: Total quantity of calcium gluconate 1g/10ml, 10 ml ampoules needed per year = C1 + C2 + C3 + C4 + Plus quantities for other level * Notes: - Average quantity of allocation per facility level per year shall consider: the incidence of the cases by level, capacity to administer the products and the minimum possible pack size for distribution to health facilities. * Please consider other health facility types, or sub-groups of the ones indicated above, as applicable to the local context -
Forecasting algorithm for ACS based on morbidity method A: Total population B: Total pregnancies = A % of pregnancies C: # of pregnancies attending ANC at public HFs = B % attending ANC at public HFs D: Public HF pregnancies at risk of preterm birth = C incidence of preterm birth E: # of pregnancies at risk of preterm birth likely to be given ACSs = D % given ACSs F: # of public HF preterm birth pregnancies given specific ACSs F1: # treated with dexamethasone = E % treated with dexamethasone OR F2: # treated with betamethasone = E % treated with betamethasone H: Quantity of each ACS required H1: Qty. of dexamethasone 4 mg/ml amp = F1 G1; where G1: average qty. of dexamethasone 4 mg/ml amp per case = 6 or 8 amps OR H2: Qty. of betamethasone 6 mg/ml vial =F2 x G2; where G2: average qty. of betamethasone 6 mg/ml vial per case = 4 vials
Forecasting algorithms for reusable resuscitation devices (bag and mask and multiuse suction device) based on allocation by facilities A: Total # of public HFs by type B: Average # of rooms where reusable resuscitation devices are required by type of public HF C: Average # of reusable resuscitation devices per room for each type of public HF D: Total # of rooms where reusable resuscitation devices are required by type of public HF = A B E: Total # of reusable resuscitation devices required for each type of the public HF = C D F: Total # of reusable resuscitation devices required for all types of public HFs = Sum the qty. of reusable resuscitation devices required by each type of health facility in the country/region i.e. Sum of Es
Forecasting algorithm for single use suction bulb (device) based on morbidity method A: Total population C: Total live births = A B; where B = CBR D: # of public HF live births = C % of public HF live births E: # of public HF birth that need suction and resuscitation devices = D % of live births that need suction and resuscitation devices F: # of public HF live births that need single-use suction bulbs = E % of cases estimated to use single-use suction bulbs H: Quantity of single-use suction bulbs required at public HFs = F G ; where G: quantity per case = 1
Forecasting algorithm for chlorhexidine digluconate used for infant cord care based on morbidity method A: Total population C: Total live births = A B; where B = CBR E: # of home live births = C % of home live births D: # of public HF live births = C % of public HF live births F: # of infants that receive chlorhexidine for umbilical care at public HFs = D % given chlorhexidine G: # of infants that receive chlorhexidine for umbilical care at home = E % given chlorhexidine H: Proportion of cases given specific regimens of chlorhexidine at public HFs (single-day or seven-day regimen) I: Proportion of cases given specific regimens of chlorhexidine at home (single-day or seven-day regimen) = F % given single-day regimen; OR = F % given seven-day regimen = G % given single-day regimen; OR = G % given seven-day regimen L: Qty. of each formulation of chlorhexidine needed at home L1: Chlorhexidine 7.1% gel 20 g tube = I J1 OR L2: Chlorhexidine 7.1% gel 3 g, sachet = I J2 K: Qty. of each formulation of chlorhexidine needed at public HFs K1: Chlorhexidine 7.1% gel 20 g tube = H J1 OR K2: Chlorhexidine 7.1% gel 3 g, sachet = H J2 where J: quantity per one case J1 = 1 tube of chlorhexidine 7.1% gel 20 g; J2 = 1 or 7 sachets of chlorhexidine 7.1% gel 3 g , for 1-day or 7-day regimen, respectively where J: quantity per one case J1 = 1 tube of chlorhexidine 7.1% gel 20 g; J2 = 1 or 7 sachets of chlorhexidine 7.1% gel 3 g , for 1-day or 7-day regimen, respectively M. Total qty. of each formulation of chlorhexidine used per year = Qty. used at public HF + qty. used at home M1: Qty. of chlorhexidine 7.1% gel 20 g, tube = K1 + L1; OR M2: Qty. of chlorhexidine 7.1% gel 3 g, sachet = K2 + L2
Forecasting algorithm for antibiotics used to treat PSBI or very severe disease in newborns based on morbidity method A: Total population C: Total live births = (A/1000) B; where B = CBR* D: Total number of PSBI or Very Severe Disease cases in infants 0-59 days = C incidence of PSBI or Very Severe Disease in infants 0-59 days E: Number of PSBI or Very Severe Disease 0-59 day cases treated in the public sector = D % of cases treated in the public sector H: # of 0-59 day clinical severe infection cases treated = E % of 0-59 day clinical severe infection cases treated F: # of severe pneumonia (fast breathing) 0-6 day cases treated = E % of cases treated G: # of severe pneumonia (fast breathing) 7-59 day cases treated = E % of cases treated I: # of 0-59 day with critical illness cases treated = E % of 0-59 day critical illness cases treated F1: Treated at 1st level HFs = F % treated at 1st level HFs F2: Treated at hospitals = F % treated at hospitals G1: Treated at 1st level HFs = G % treated at 1st level HFs G2: Treated at hospitals = G % treated at hospitals H1: Treated at 1st level HFs = H % treated at 1st level HFs H2: Treated at hospitals = H % treated at hospitals I1: Treated at 1st level HFs = I % treated at 1st level HFs I2: Treated at hospitals = I % treated at hospitals J: # of severe pneumonia (fast breathing) 0-6 day cases treated with specific regimens by level of care K: # of severe pneumonia (fast breathing) 7-59 day cases treated with specific regimens by level of care L: # of 0-59 day cases with clinical severe infection treated with specific regimens by level of care: M: # of 0-59 day cases with critical illness treated with specific regimens by level of care: J2: # treated with 10- day gentamicin (IV/IM) and 10 day ampicillin (IV/IM) at hospitals = F2 J3: # treated with 10- day ceftriaxone (IV/IM) at hospitals = F2 x % that need 2nd line treatment Plus other regimens**** M2: # treated with 10-day gentamicin (IV/IM) and 10-day ampicillin (IV/IM) at hospitals = I2 M3: # treated with 10-day ceftriaxone (IV/IM) at hospitals = I2 x % treated with 2nd line regimen Plus other regimens**** L2: 10-day gentamicin (IV/IM) and 10-day ampicillin (IV/IM) at hospitals = H2 L3: 10-day ceftriaxone (IV/IM) at hospitals = H2 x % treated with 2nd line regimen Plus other regimens**** K2: # treated with 7- day oral amoxicillin at hospitals = G2 K3: # treated with 10-day ceftriaxone (IV/IM) at hospitals = G2 x % that need 2nd line treatment L1: # treated with 2- day or 7-day gentamicin (IM)* and 7-day oral amoxicillin at 1st level HFs = H1 M1: # treated with 7- day gentamicin (IM) and 7-day ampicillin (IM) at 1st level HFs = I1 J1: # treated with 7- day oral amoxicillin at 1st level HFs = F1 K1: # treated with 7- day oral amoxicillin at 1st level HFs = G1 N: Qty. of each medicine required to treat a PSBI or very severe disease case at 1st-level HFs = # of cases treated with each medicine by group average quantity of each medicine per case (O)** N1: Amoxicillin 250 mg DT = [(J1 + K1 + L1)) O1]; where O1 = 7 tablets N2: Gentamicin 40 mg/ml, 2 ml vials = [(L1 x O2) + (M1 O3)]; where O2 = 7 or 2*** vials and O3 = 7 vials N3: Ampicillin 500 mg vials = [M1 O4]; where O4 = 14 Vials Plus other medicines**** P: Qty. of each medicine required to treat PSBI or very severe disease cases at hospitals = # of cases treated with each medicine by group average quantity of each medicine per case (Q)** P1: Amoxicillin 250 mg DT = [K2 Q1]; where Q1 = 7 tablets P2: Gentamicin 40 mg/ml, 2 ml vials = [(J2 + L2 + M2)) Q2]; where Q2 = 10 vials P3: Ampicillin 500 mg vials = [(J2 + L2 + M2)) Q3]; where Q3 = 30 vials P4: Ceftriaxone 250 mg vials = [(J3 + K3 + L3 + M3) Q4]; where Q4 = 10 vials Plus other medicines **** R: Qty. of each medicine required to treat all PSBI or very severe disease cases in the public sector [= Qty. required for 1st-level HFs + Qty. required in hospitals, by medicine]; i.e. R = N + P R1: Amoxicillin 250 mg DT = N1 + P1 2 ml vials = N2 + P2; R2: Gentamicin 40 mg/ml, R3: Ampicillin 500 mg vials = N3 + P3 R4: Ceftriaxone 250 mg vials = P4; Plus other medicines****
Forecasting algorithm for antibiotics used to treat pneumonia in children 2 59 months based on morbidity method A: Total population B: Total population of 2-59m = A % of 2-59 m C: # of under 2-59 m pneumonia cases = B incidence of pneumonia D: # of under 2-59 m pneumonia cases treated in public health care services, including CHWs = C % of cases treated in public sector services E: # of 2-59 m pneumonia cases treated by level of care E1: # at community level (by CHWs) = D % treated at community level; E2:. # at 1st-level public HFs = D % treated at 1st-level public HFs; E3: # at public hospitals = D % treated at public hospitals H: # of 2-59 m pneumonia cases treated by type: public hospital G: # of 2-59 m pneumonia cases treated by type: 1st-level public HFs F: # of 2-59 m pneumonia cases treated by type: Community level H1: # of fast-breathing cases = E3 % of fast-breathing pneumonia treated; H2: # of HIV- ve and chest-in-drawing cases = E3 % of HIV-ve and chest-in-drawing pneumonia treated H3: # of severe, or HIV + ve chest-in- drawing cases = E3 % of severe, or HIV+ ve chest-in-drawing pneumonia G1: # of fast-breathing cases = E2 % of fast-breathing pneumonia treated G2: # of HIV-ve and chest-in-drawing cases = E2 % of HIV- ve and chest-in-drawing pneumonia treated F1: # of fast-breathing cases = E1 % of fast-breathing pneumonia treated* * Assumes only fast breathing cases are treated at community level K: # of 2-59 m pneumonia cases treated with specific regimen: public hospitals I: # of 2-59 m pneumonia cases treated with specific regimen: Community level J: # of 2-59 m pneumonia cases treated with specific regimen: 1st-level public HFs J: # treated with 5-day oral amoxicillin = (G1 + G2) % treated with the regimen K1: # treated with 5-day oral amoxicillin = (H1 + H2) % treated with the regimen; K2: # treated with 5-day gentamicin IV/IM and ampicillin IV/IM= H3 % treated with the regimen Plus other regimens I: # treated with 5-day oral amoxicillin = F % treated with the regimen Q: Qty. of each medicine required by age group: Public hospitals Q1: Amoxicillin 250 mg DT for 2-11m = K1 % of age group P1; where P1: Qty per case =10 DTs Q2: Amoxicillin 250 mg DT for 12-36 m = K1 % of age group P2; where P2= Qty per case =20 DTs Q3: Amoxicillin 250 mg DT for 37-59 m = K1 % of age group P3; where P3: Qty per case =30 DTs Plus other medicines O: Qty. of each medicine required by age group: 1st-level public HFs O1: Amoxicillin 250 mg DT for 2-11 m = J % of age group N1; where N1: Qty per case =10 DTs O2: Amoxicillin 250 mg DT for 12-36 m = J % of age group N2; where N2: Qty per case =20 DTs O3: Amoxicillin 250 mg DT for 37-59 m = J % of age group N3; where N3: Qty per case =30 DTs M: Qty. of each medicine required by age group: Community level M1: Amoxicillin 250 mg DT for 2-11 m = I % of age group L1; where L1: Qty per case = 10 DTs M2: Amoxicillin 250 mg DT for 12-59m = I % of age group L2; where L2: Qty per case = 20 DTs R: Qty. of each medicine required to treat 2-59 m pneumonia cases in public sector = Qty. for Community (M) + Qty. for 1st-level public HFs (O) + Qty. for public hospitals (Q) R1: Amoxicillin 250 mg DT = (M1 + M2) + (O1 + O2 + O3) + (Q1 + Q2 + Q3) Plus other medicines
Forecasting algorithm for amoxicillin used to treat nonsevere pneumonia in children 2 59 months based on morbidity method (simplified version) A: Total population B: Total population of 2-59m = A % of 2-59 m C: # of under 2-59 m pneumonia cases = B incidence of pneumonia D: # of under 2-59 m pneumonia cases treated in public health care services, including CHWs = C % of cases treated in public sector E: # of 2-59 m pneumonia cases treated by level of care E1: # at community level (by CHWs) = D % treated at community level; E2:. # at 1st-level public HFs = D % treated at public HFs; G: # of 2-59 m pneumonia cases treated by type: Public HFs** F: # of 2-59 m pneumonia cases treated by type : Community level* G1 = E2 % of fast breathing cases treated at public HFs G2 = E2 % of HIV-ve and Chest-indrawing cases treated at public HFs F = E1 % of fast breathing cases treated at community level I. # of 2-59 m pneumonia cases treated with specific regimen: Public HFs* H: # of 2-59 m pneumonia cases treated with specific regimen: Community level* H: # treated with 5-day oral amoxicillin = (G1+G2) % treated with the regimen; H: # treated with 5-day oral amoxicillin = F % treated with the regimen M: Qty. of each medicine required by age group: Public HFs M1: Amoxicillin 250 mg DT for 2-11m = I % of age group L1; where L1: Qty per case =10 DTs M2: Amoxicillin 250 mg DT for 12-36 m = I % of age group L2; where L2= Qty per case =20 DTs M3: Amoxicillin 250 mg DT for 37-59 m = I % of age group L3; where L3: Qty per case =30 DTs K: Qty. of each medicine required by age group: Community level K1: Amoxicillin 250 mg DT for 2-11 m = H % of age group J1; where J1: Qty per case = 10 DTs K2: Amoxicillin 250 mg DT for 12-59m = H % of age group J2; where J2: Qty per case = 20 DTs N: Qty. of each medicine required to treat 2-59 m pneumonia cases in public sector = Qty. for Community (K) + Qty. for public HFs (M) N1 Qty of Amoxicillin 250 mg DT = (K1 + K2) + (M1 + M2 + M3)
Forecasting algorithm for products used to treat diarrhea in children under 5 based on morbidity method A: Total population B: Total population of under 5 years = A % of <5 years C: # of under 5-year diarrhea cases = B incidence of diarrhea D: # of under 5-year diarrhea cases treated in public health care services, including CHWs = C % of cases treated in public sector services E: # of under 5-year diarrhea cases treated by level of care E1: # at community level (by CHWs) = D % treated at community level; E2: # at 1st-level public HFs = D % treated at 1st-level public HFs; E3: # at public hospitals = D % treated at public hospitals G: # of under 5-year diarrhea cases treated by type at 1st level public HFs* H: # of under 5-year diarrhea cases treated by type at public hospitals* H1: # of non-severe diarrhea = E3 x % of non-severe diarrhea treated; H2: # of severe diarrhea = E3 x % of severe diarrhea treated F: # of under 5-year diarrhea cases treated by type at community level by CHWs* G: # of non-severe diarrhea F: # of non-severe diarrhea without blood = E1 x % of non- severe diarrhea without blood treated = E2 x % of non-severe diarrhea treated K and L: # of under 5-year diarrhea cases treated with specific regimen: public hospitals K1: # non severe diarrhea without blood treated with 2-day ORS & 10-day Zinc = H1 x % treated with the regimen K2: # non severe diarrhea with blood treated with 2- day ORS, 10-day Zinc & 3-day Ciprofloxacin or 5-day Metronidazole = H1 x % treated with the regimen; L1: # severe diarrhea without blood treated with Ringer's solution stat, 2-day ORS and 10-day Zinc = H2 x % treated with the regimen; L2: # severe diarrhea with blood treated with Ringer's solution stat, 2-day ORS, 10-day Zinc, 3-day Ceftriaxone or 5-day Metronidazole = H2 x % treated with the regimen J: # of under 5-year diarrhea cases treated with specific regimen at 1st level public HFs I: # of under 5-year diarrhea cases treated with specific regimen at community level by CHWs J1: # non-severe without blood treated with 2-day ORS & 10-day Zinc I: # non-severe without blood treated with 2-day ORS & 10-day Zinc = G x % treated with the regimen; J2: # non-severe with blood treated with 2-day ORS, 10-day Zinc & 3-day Ciprofloxacin or 5-day Metronidazole = G x % treated with the regimen = F x % treated with the regimen N: Quantity of each medicine required by age group: Community level (CHWs) N1: ORS 20.5g = I x M1; where M1: quantity per case = 2 sachets; N2a: Zinc 20mg DT for 2-5m = I x % treated x M2a; where M2a: quantity per case = 5 DTs N2b: Zinc 20mg DT for 6-59m = I x % treated x M2b; where M2b: quantity per case = 10 DTs P: Quantity of each medicine required by age group at 1st level public HFs P1: ORS 20.5g = (J1+J2) x O1; where O1: quantity per case = 2 sachets P2a: Zinc 20mg DT for 2-5m = (J1+J2) x % treated x O2a; where O2a: quantity per case = 5 DTs P2b: Zinc 20mg DT for 6-59m = (J1+J2) x % treated x O2b; where O2b: quantity per case = 10 DTs Plus other medicines R: Quantity of each medicine required by age group at public hospitals R1: ORS 20.5g = (K1+K2+L1+L2) x Q1; where Q1: quantity per case = 2 sachets R2a: Zinc 20mg DT for 2-5m = (K1+K2+L1+L2) x % treated x Q2a; where Q2a: quantity per case = 5 DTs R2b: Zinc 20mg DT for 6-59m = (K1+K2+L1+L2) x % treated x Q2b; where Q2b: quantity per case = 10 DTs Plus other medicines S: Quantity of each medicine required to treat under 5-year diarrhea cases in public sector = Community (N) + 1st level public HFs (P) + Public hospitals (R) S1: ORS low Osm. 20.5g sachets = N1 + P1 + R1 S2: Zinc 20mg DT = N2a + N2b + P2a + P2b + R2a + R2b Plus other medicines
Forecasting algorithm for ORS and zinc used to treat diarrhea in children under 5 based on morbidity method (simplified version) A: Total population B: Total population of under 5 years = A % of <5 years C: # of under 5-year diarrhea cases = B incidence of diarrhea D: # of under 5-year diarrhea cases treated in public health care services, including CHWs = C % of cases treated in public sector services E : # of under 5-year diarrhea cases treated with 2-day ORS and 10-day zinc = D x % treated with the regimen G: Quantity of each medicine required by age group G1: ORS 20.5g = E x F1; where F1: quantity per case = 2 sachets G2a: Zinc 20mg DT for 2-5m = E x % treated x F2a; where F2a: quantity per case = 5 DTs G2b: Zinc 20mg DT for 6-59m = E x % treated x F2b; where F2b: quantity per case = 10 DTs H: Quantity of each medicine required to treat under 5-year diarrhea cases in public sector H1: ORS low Osm. 20.5g sachets = G1 H2: Zinc 20mg DT = G2a + G2b This algorithm only takes into account ORS and zinc and no other antibiotics or fluids that may be needed for the more severe cases covered in the previous algorithm