Alphabet Financial Insights in 5 Slides
Explore Alphabet's financial performance in 5 slides covering market cap comparison with Apple, quarterly performance analysis, segment revenue trends, Google segment breakdown, and income insights. Discover how Alphabet's base business is driving revenue growth while managing Other Bets challenges efficiently.

Download Presentation

Please find below an Image/Link to download the presentation.
The content on the website is provided AS IS for your information and personal use only. It may not be sold, licensed, or shared on other websites without obtaining consent from the author. If you encounter any issues during the download, it is possible that the publisher has removed the file from their server.
You are allowed to download the files provided on this website for personal or commercial use, subject to the condition that they are used lawfully. All files are the property of their respective owners.
The content on the website is provided AS IS for your information and personal use only. It may not be sold, licensed, or shared on other websites without obtaining consent from the author.
E N D
Presentation Transcript
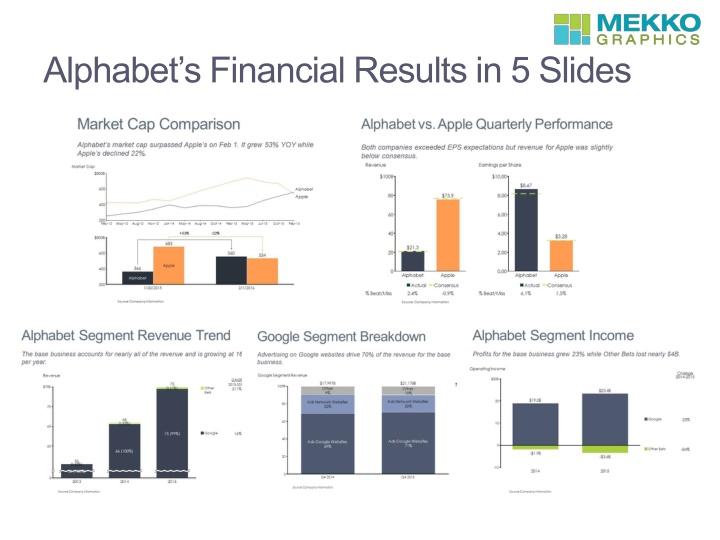
Market Cap Comparison Alphabet s market cap surpassed Apple s on Feb 1. It grew 53% YOY while Apple s declined 22%. Source Company information
Alphabet vs. Apple Quarterly Performance Both companies exceeded EPS expectations but revenue for Apple was slightly below consensus. Source: Company information
Alphabet Segment Revenue Trend The base business accounts for nearly all of the revenue and is growing at 16% per year. Source Company information
Google Segment Breakdown Advertising on Google websites drives 70%+ of the revenue for the base business. Source Company information
Alphabet Segment Income Profits for the base business grew 23% while Other Bets lost nearly $4B. Source Company information