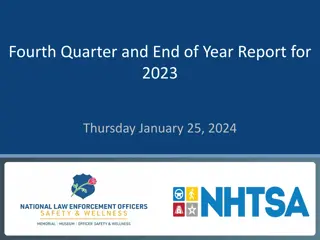
Analysis of 2023 Crash Data - Fatalities and Injuries Overview
This analysis delves into the data regarding crash incidents in 2023, including fatal crashes, serious injuries, minor injuries, possible injuries, and property damage. The numbers reveal a concerning trend over the years, highlighting the need for enhanced safety measures on the roads.
Download Presentation

Please find below an Image/Link to download the presentation.
The content on the website is provided AS IS for your information and personal use only. It may not be sold, licensed, or shared on other websites without obtaining consent from the author.If you encounter any issues during the download, it is possible that the publisher has removed the file from their server.
You are allowed to download the files provided on this website for personal or commercial use, subject to the condition that they are used lawfully. All files are the property of their respective owners.
The content on the website is provided AS IS for your information and personal use only. It may not be sold, licensed, or shared on other websites without obtaining consent from the author.
E N D
Presentation Transcript
2023 Crash 2023 Crash Data Data
Fatal Crashes 3,000 1,356 1,275 1,242 1,230 2,500 1,155 2,000 Number Killed 1,500 1,244 Crashes 1,180 1,154 1,150 1,041 1,000 500 0 2019 2020 2021 2022 2023
Serious Injury Crashes 6,500 6,405 6,400 6,300 6,163 6,200 6,100 6,059 5,982 6,000 5,925 5,900 5,800 5,700 5,600 2019 2020 2021 2022 2023
Minor Injury Crashes 38,000 36,791 37,000 36,000 35,170 35,000 34,000 33,458 32,670 33,000 32,438 32,000 31,000 30,000 2019 2020 2021 2022 2023
Possible Injury Crashes 35,000 31,506 30,000 28,202 26,327 25,963 25,171 25,000 20,000 15,000 10,000 5,000 0 2019 2020 2021 2022 2023
Property Damage Crashes 250,000 221,154 198,658 198,383 200,000 187,577 180,349 150,000 100,000 50,000 0 2019 2020 2021 2022 2023
Total Crashes 350,000 296,474 300,000 269,679 265,511 252,627 245,829 250,000 200,000 150,000 100,000 50,000 0 2019 2020 2021 2022 2023
Total Number Injured 110,000 108,102 105,000 100,353 100,000 94,990 95,000 92,273 92,229 90,000 85,000 80,000 2019 2020 2021 2022 2023
Impaired Driving Fatal Crashes 1,400 1,244 1,180 1,154 1,150 1,200 1,041 1,000 800 672 668 652 637 600 529 507 486 457 443 369 381 400 404 388 384 331 292 306 275 200 255 201 0 2019 2020 2021 2022 2023 Total Fatals OVI Related Drug Related Alcohol Related Marijuana Related
Pedestrian Related Crashes 600 525 517 516 506 500 456 400 300 173 200 167 164 149 129 100 0 2019 2020 2021 2022 2023 Fatal Serious Injury
Bicycle Related Crashes 180 158 152 160 151 148 140 120 120 100 80 60 40 28 23 22 16 20 7 0 2019 2020 2021 2022 2023 Fatal Serious Injury
Work Zone Related Crashes 120 114 114 100 96 100 86 80 60 40 25 20 18 15 20 8 0 2019 2020 2021 2022 2023 Fatal Serious Injury
Motorcycle Crashes 250 236 223 214 212 200 160 159 157 156 155 150 156 122 115 114 113 100 79 50 0 2019 2020 2021 2022 2023 Motorcycle Fatalities No Helmet Motorcycle Driver OVI
Distracted Driving 350 328 325 300 280 271 241 250 200 150 100 41 37 35 50 29 29 0 2019 2020 2021 2022 2023 Fatal Serious Injury
Seatbelt Usage 1,600 1,356 1,400 1,275 1,242 1,230 1,155 1,200 1,000 899 842 818 814 793 800 576 527 600 502 477 472 400 200 0 2019 2020 2021 2022 2023 Fatalities Fatalities w/Available Belt Unbelted #
Top Crashes Causes Fatal Crashes 1 27% - Drove Off Road 2 16% - Unsafe Speed 3 14% - Failure to Yield 4 11% - Left of Center 5 8% - Following too Close / ACDA
Top Crashes Causes Serious Injury Crashes 1 24% - Failure to Yield 2 22% - Drove Off Road 3 11% - Unsafe Speed 4 10% - Following too Close / ACDA 5 9% - Left of Center
Top Crashes Causes Minor Injury Crashes 1 26% - Failure to Yield 2 22% - Following too Close / ACDA 3 16% - Drove Off Road 4 7% - Unsafe Speed 5 7% - Ran Red Light
Top Crashes Causes Possible Injury Crashes 1 33% - Following too Close / ACDA 2 23% - Failure to Yield 3 11% - Drove Off Road 4 6% - Ran Red Light 5 5% - Improper Lane Change
Top Crashes Causes Property Damage Crashes 1 29% - Following too Close / ACDA 2 17% - Failure to Yield 3 11% - Drove Off Road 4 10% - Improper Lane Change 5 6% - Improper Backing
Top Crashes Causes All Crashes 1 28% - Following too Close / ACDA 2 20% - Failure to Yield 3 12% - Drove Off Road 4 8% - Improper Lane Change 5 5% - Unsafe Speed
