Analysis of Arab Voters in the 2021 Knesset Elections
Explore the comprehensive data and breakdown of Arab voter turnout, party preferences, and trends in the 24th Knesset Elections held in March 2021. Understand the participation rates, voting patterns, and achievements of Arab parties in this significant election.
Download Presentation

Please find below an Image/Link to download the presentation.
The content on the website is provided AS IS for your information and personal use only. It may not be sold, licensed, or shared on other websites without obtaining consent from the author. If you encounter any issues during the download, it is possible that the publisher has removed the file from their server.
You are allowed to download the files provided on this website for personal or commercial use, subject to the condition that they are used lawfully. All files are the property of their respective owners.
The content on the website is provided AS IS for your information and personal use only. It may not be sold, licensed, or shared on other websites without obtaining consent from the author.
E N D
Presentation Transcript
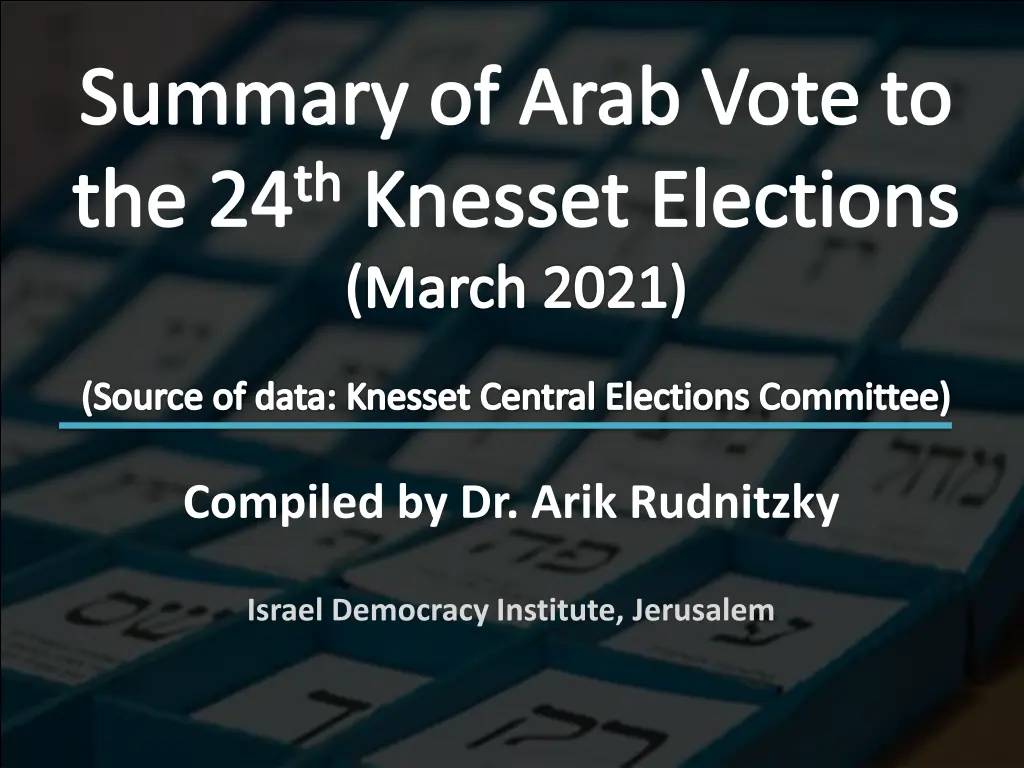
Summary of Arab Vote to the 24thKnesset Elections (March 2021) (Source of data: Knesset Central Elections Committee) Compiled by Dr. Arik Rudnitzky Israel Democracy Institute, Jerusalem
The 24thKnesset Elections in Numbers Overall turnout in Arab and Druze localities 44.6% Breakdown of the votes for Arab parties vs. Jewish parties 80 : 20 seat Arab sector s support of the Likud
Election Turnout, 1999-2021 Nationwide Arab localities 78.7% 72.3% 71.5% 69.8% 68.5% 67.8% 67.8% 67.4% 75.0% 64.7% 63.5% 64.8% 63.5% 62.0% 59.2% 56.5% 56.3% 53.4% 49.2% 44.6% 1999 2003 2006 2009 2013 2015 Apr-19 Sep-19 2020 2021
Participation of Arab Citizens in the Elections, 2019-2021 Knesset 21 Knesset 22 Knesset 23 Knesset 24 68.0% 65.8% 64.8% 60.5% 60.4% 59.2% 56.5% 56.0% 52.9% 52.1% 52.0% 49.9% 49.2% 46.9% 44.6% 42.4% 42.3% 41.5% 40.0% 37.5% Total North of the Country The Triangle Jerusalem region The Negev
Breakdown of Arab Vote in Knesset Elections, 1999-2021* Arab parties Jewish parties 87.6% 83.2% 81.9% 81.6% 80.1% 77.2% 71.9% 71.6% 69.2% 68.6% 31.4% 30.8% 28.4% 28.1% 22.8% 19.9% 18.4% 18.1% 16.8% 12.4% 1999 2003 2006 2009 2013 2015 Apr-19 Sep-19 2020 2021 * Including lists that did not pass the electoral threshold; Data refers to the vote in Arab and Druze localities only, excluding Arab inhabitants in mixed cities, double envelopes and the rest of the country.
Breakdown of Eligible Arab Voters in Knesset Elections, 1999-2021 * Arab parties Jewish parties Did not vote 56.8% 55.4% 52.8% 51.5% 50.8% 48.3% 46.6% 43.7% 43.6% 42.9% 43.7% 43.5% 40.8% 40.5% 38.0% 36.5% 35.7% 35.2% 35.2% 25.0% 23.6% 19.1% 15.8% 14.0% 12.9% 10.9% 10.7% 9.7% 8.9% 8.0% 1999 2003 2006 2009 2013 2015 Apr-19 Sep-19 2020 2021 * Including lists that did not pass the electoral threshold; Data refers to the vote in Arab and Druze localities only
Arab Parties Achievements in the 24thKnesset Elections 212,583 votes 6 seats 167,064 votes 4 seats Joint List 11,145 6,547 28,358 165,998 United Arab List 6,611 1,665 6,934 151,922 Double envelopes Rest of the country Mixed cities Arab localities
Arab Parties Achievements in Knesset Elections, 2019-2021 - 100,000 200,000 300,000 400,000 500,000 600,000 379,647 votes 10 seats Knesset 24 581,507 votes 15 seats Knesset 23 470,211 votes 13 seats Knesset 22 337,108 votes 10 seats Knesset 21 Knesset 21 292,500 31,158 6,462 6,988 Knesset 22 404,443 44,400 9,394 11,974 Knesset 23 492,690 55,585 15,155 18,077 Knesset 24 318,412 35,371 8,051 17,813 Arab localities Mixed cities Rest of the country Double envelopes
Breakdown of the Votes for Arab Parties, 24thKnesset Elections The United Arab List: 167,064 votes The Joint List: 212,583 votes Mixed cities 4.2% Rest of the country 0.9% Double envelopes 4.0% Rest of the country 3.1% Double envelopes 5.3% Jerusalem region 0.4% Jerusalem region 0.7% Mixed cities 13.4% Negev 4.2% Negev 25.2% North of the country 48.7% North of the country 52.7% The Triangle 20.7% The Triangle 16.7%
Breakdown of the Vote in Arab and Druze Localities | Turnout 44.6% Joint List 41.9% UAL 38.3% Jewish parties, 19.8% Likud 5.2% Meretz 3.7% Yisrael Beitenu 3.2% Yesh Atid 2.1% Shas 1.3% Arab parties, 80.2% New Hope 1.2% Blue-White 1.0% Labor 0.9% * Including lists that did not pass the electoral threshold
Breakdown of the Arab vote in the North of the Country | Turnout 46.9% Joint List 43.5% UAL 31.6% Jewish parties, 24.8% Likud 6.4% Meretz 3.5% Yisrael Beitenu 5.0% Yesh Atid 2.8% Shas 1.8% Arab parties, 75.2% New Hope 1.6% Blue-White 1.4% Labor 1.2% * Including lists that did not pass the electoral threshold
Breakdown of the Bedouin Vote in the North of the Country | Turnout 39.2% Joint List 18.5% UAL 58.2% Jewish parties, 23.4% Likud 11.3% Meretz 3.0% Yisrael Beitenu 0.3% Yesh Atid 2.1% Shas 1.2% Arab parties, 76.6% New Hope 2.6% Blue-White 0.5% Labor 1.2% * Including lists that did not pass the electoral threshold
Breakdown of the Vote in Druze Localities | Turnout 46.4% Joint List 11.9% UAL 4.9% Arab parties, 16.8% Likud 17.8% Meretz 6.4% Yisrael Beitenu 25.9% Yesh Atid 10.2% Shas 5.1% Jewish parties, 83.2% New Hope 4.2% Blue-White 6.9% Labor 3.6% * Including lists that did not pass the electoral threshold
Breakdown of the Vote in Christian Localities | Turnout 54% Joint List 59.4% UAL 6.0% Likud 8.1% Jewish parties, 34.6% Meretz 15.3% Yisrael Beitenu 0.4% Yesh Atid 5.0% Arab parties, 65.4% Shas 1.3% New Hope 1.6% Blue-White 0.9% Labor 1.2% * Including lists that did not pass the electoral threshold
Support of Arab Parties, Northern Region, 2019-2021 Elections Knesset 21 Knesset 22 Knesset 23 Knesset 24 84.2% 82.4% 79.7% 76.6% 76.6% 75.2% 68.3% 66.9% 66.3% 65.4% 54.0% 48.8% 21.2% 16.8% 15.5% 10.9% Northern Region - Total Bedouin Christian Druze
Breakdown of the Vote in the Triangle Region Overview | Turnout 40.0% Joint List 55.0% Jewish parties, 10.2% UAL 34.8% Likud 1.3% Meretz 5.7% Yisrael Beitenu 0.0% Yesh Atid 1.1% Shas 0.4% New Hope 0.3% Arab parties, 89.8% Blue-White 0.1% Labor 0.6% * Including lists that did not pass the electoral threshold
Breakdown of the Vote in the Southern Triangle | Turnout 46.6% Joint List 46.3% Jewish parties, 11.9% UAL 41.8% Likud 1.0% Meretz 7.4% Yisrael Beitenu 0.0% Yesh Atid 1.5% Shas 0.2% New Hope 0.3% Arab parties, 88.1% Blue-White 0.2% Labor 0.8% * Including lists that did not pass the electoral threshold
Breakdown of the Vote in the Northern Triangle | Turnout 35% Joint List 63.8% Jewish parties, 8.4% UAL 27.8% Likud 1.7% Meretz 4.1% Yisrael Beitenu 0.0% Yesh Atid 0.7% Shas 0.5% New Hope 0.3% Arab parties, 91.6% Blue-White 0.1% Labor 0.3% * Including lists that did not pass the electoral threshold
Breakdown of the Vote in the Jerusalem Area| Turnout 42.4% Joint List 46.9% UAL 19.2% Likud 19.2% Jewish parties, 33.9% Meretz 4.7% Yisrael Beitenu 0.1% Yesh Atid 2.1% Arab parties, 66.1% Shas 3.9% New Hope 0.6% Blue-White 0.6% Labor 1.5% * Including lists that did not pass the electoral threshold
Breakdown of the Negev Bedouin Vote Overview | Turnout 42.3% Joint List 15.9% Jewish parties, 9.6% UAL 74.5% Likud 4.4% Meretz 1.4% Yisrael Beitenu 0.0% Yesh Atid 0.6% Shas 0.2% New Hope 0.5% Arab parties, 90.4% Blue-White 0.1% Labor 0.3% * Including lists that did not pass the electoral threshold
Breakdown of the Vote in Negev Bedouin Townships | Turnout 45.8% Joint List 20.2% Jewish parties, 10.1% UAL 69.8% Likud 4.0% Meretz 1.7% Yisrael Beitenu 0.1% Yesh Atid 0.7% Shas 0.2% New Hope 0.7% Arab parties, 89.9% Blue-White 0.2% Labor 0.3% * Including lists that did not pass the electoral threshold
Breakdown of Bedouin Vote in Negev Regional Councils | Turnout 50.5% Joint List 6.1% Jewish parties, 14.8% UAL 79.2% Likud 10.4% Meretz 0.9% Yisrael Beitenu 0.0% Yesh Atid 0.9% Shas 0.2% New Hope 0.1% Arab parties, 85.2% Blue-White 0.2% Labor 0.4% * Including lists that did not pass the electoral threshold
Breakdown of the Vote of Negev Bedouin Tribes | Turnout 32.4% Joint List 6.4% Jewish parties, 6.1% UAL 87.5% Likud 3.1% Meretz 0.5% Yisrael Beitenu 0.0% Yesh Atid 0.3% Shas 0.3% New Hope 0.2% Arab parties, 93.9% Blue-White 0.1% Labor 0.3% * Including lists that did not pass the electoral threshold
Turnout of Arab Residents in Mixed Jewish-Arab Cities 55.1% Haifa 46% 53.2% Lod 34% 58.3% 56% Ma'alot-Tarshiha 50.5% Nof Hagalil Entire city 59% Arabs (est.) 52.7% Akko 38% 56.3% Ramle 39% 60.0% Tel Aviv - Jaffa 40% 67.4% Nationwide 44.6%
Turnout of Arab Voters in Mixed Cities: 23rd, 24thKnesset Elections 55% Haifa 46% 55% Lod 34% 71% Ma'alot-Tarshiha 56% Knesset 23 63% Nof Hagalil 59% Knesset 24 62% Akko 38% 60% Ramle 39% 54% Tel Aviv - Jaffa 40%
Arab Votes to Jewish Parties March 2021 Elections * 36,200 votes = 1 seat 20,580 14,521 12,899 8,459 5,123 4,596 3,915 3,722 989 Likud Meretz Yisrael Beitenu Yesh Atid Shas New HopeBlue-White Labor Yemina * The data refer to the vote of Arab citizens in Arab and Druze localities only. These figures do not include the vote of Arab residents living in mixed Jewish-Arab cities or in different localities throughout the country, or votes in double envelopes.
Jewish Parties Achievements in the Arab sector, 2019-2021 Elections * Knesset 21 Knesset 22 Knesset 23 Knesset 24 41,593 38,684 33,620 29,904 25,176 24,352 18,607 18,243 12,899 12,374 12,302 12,246 10,110 8,687 8,445 8,028 6,509 6,311 5,123 4,426 Likud + Kulanu + New Hope Labor + Meretz Yisrael Beitenu Blue-White + Yesh Atid Shas * The data refer to the vote of Arab citizens in Arab and Druze localities only. These figures do not include the vote of Arab residents living in mixed Jewish-Arab cities or in different localities throughout the country, or votes in double envelopes.


