Analysis of Bacteraemia and Excess Risk from Microbiology Data
Data on bacteraemia cases from microbiology reports for quality analysis. Analyzing trends, correlations to risk factors, and outcomes in patients. Visual representations included for better understanding. Investigation covers various pathogens and time to first infection.

Download Presentation

Please find below an Image/Link to download the presentation.
The content on the website is provided AS IS for your information and personal use only. It may not be sold, licensed, or shared on other websites without obtaining consent from the author.If you encounter any issues during the download, it is possible that the publisher has removed the file from their server.
You are allowed to download the files provided on this website for personal or commercial use, subject to the condition that they are used lawfully. All files are the property of their respective owners.
The content on the website is provided AS IS for your information and personal use only. It may not be sold, licensed, or shared on other websites without obtaining consent from the author.
E N D
Presentation Transcript
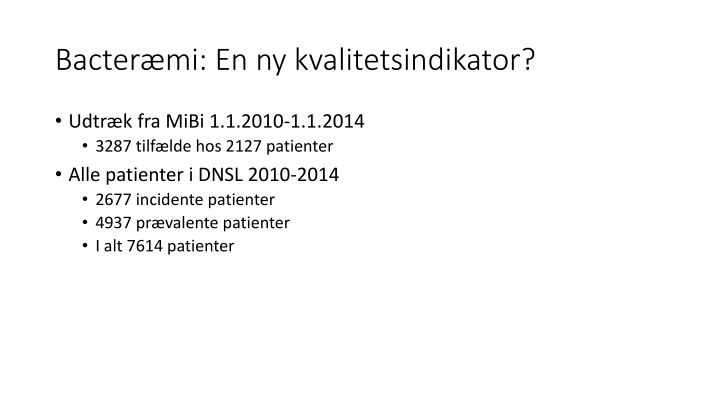
Bactermi: En ny kvalitetsindikator? Udtr k fra MiBi 1.1.2010-1.1.2014 3287 tilf lde hos 2127 patienter Alle patienter i DNSL 2010-2014 2677 incidente patienter 4937 pr valente patienter I alt 7614 patienter
Microbiology: First Bacteraemia Fungus 1% Other 2% Gm- other 7% Pseudomonas 2% S. Aureus 26% Klebsiella 6% Enterobacter 3% Staphylococcus 46% Gram negative 36% E. coli 15% S. other 11% Gm+ other 5% S. Uspec 9% Enterococcus 7% Streptococcus 6% Other Gram positive 18%
Microbiology: First and Fourth Bacteraemia Fungus 1% Other 2% Gm- other 7% Fungus 4% Other 0% Pseudomonas 2% Gm- other 12% S. Aureus 21% S. Aureus 26% Klebsiella 6% Pseudomonas 2% Enterobacter 3% Klebsiella 6% Enterobacter 2% S. other 13% E. coli 15% E. coli 7% S. other 11% Gm+ other 7% Gm+ other 5% S. Uspec 6% S. Uspec 9% Enterococcus 7% Streptococcus 4% Streptococcus 6% Enterococcus 16%
Time to first Bacteraemia 1,00 0,95 Excess risk Excess Risk HD 12% RT 10% PD 0% 0,90 PD 0,85 Cumulative Proportion Surviving RT 0,80 0,75 Annual Risk HD 14% PD 9% RT 2% 0,70 HD 0,65 0,60 6-month Incidence HD 18% PD 4% RT 14% 0,55 0,50 0,45 P<0.001 0,40 0,0 0,5 1,0 1,5 2,0 2,5 3,0 3,5 4,0 4,5 5,0 5,5 Time (years)
Planned vs. Unplanned HD 1,00 0,95 0,90 Excess Risk AV Fistula Permanent Tunneled 5% Temporary Tunneled 11% Temporary 0,85 1% Cumulative Proportion Surviving 0,80 AV Fistula 0,75 18% 0,70 Annual Risk AV Fistula Permanent Tunneled 16% Temporary Tunneled 14% Temporary 0,65 13% Permanent Tunneled 0,60 Temporary 0,55 13% Temporary Tunneled 0,50 0,45 P<0.001 0,40 0,0 0,5 1,0 1,5 2,0 2,5 3,0 3,5 4,0 4,5 5,0 Time
Correlations to excess risk and annual rate of bacteraemia (1) Age DM 16 16 14 14 12 12 10 10 <50 yrs No 8 8 % >50 yrs Yes 6 6 4 4 2 2 0 0 Excess Risk Annual rate Excess Risk Annual Rate All patients Sex: No effect
Correlations to excess risk and annual rate of bacteraemia (2) Charlson Comorbidity Index Gram Stain 18 9 16 8 14 7 2 12 6 3 10 5 Negative 4 8 4 % Positive 5 6 3 4 2 >5 2 1 0 0 Excess Risk Annual Rate Excess Risk Annual Rate All patients
Patient survival after first bacteraemia 1,0 0,9 Excess Risk HD PD 0,8 22% 14% Cumulative Proportion Surviving 0,7 PD Annual Risk HD PD 0,6 20% 11% 0,5 HD 0,4 0,3 0,2 P<0.01 0,1 0,0 0,5 1,0 1,5 2,0 2,5 3,0 3,5 4,0 4,5 5,0 Time
Correlations to mortality after first bacteraemia (1) Access (HD patients only) Age (All patients) 35 35 30 30 AV fistula 25 25 <50 Permanent tunneled 20 20 50-59 15 15 Temporary tunneled 60-69 % 10 10 >70 Temporary 5 5 0 0 Excess risk Bacteraemia less than 6 months after ESRD Annual rate Excess Risk Annual Rate Number needed to kill (NNK) Temporary 33 Temporary tunneled 70
Correlations to mortality after first bacteraemia (2) Charlson Comorbidity Index 35 30 25 2 Gram stain, DM & Sex: No effect 20 3 4 % 15 5 10 >5 5 0 Excess Risk Annual Rate All patients
Quality Indicators by Center 2010-14 45 40 35 HD Bacteraemia Incidence 30 25 HD Bacteraemia Incidence first 6 months 20 Mortality 6 months after Bacteraemia (all patients) 15 10 5 0 9 12 11 14 10 8 5 7 2 1 4 13 6 3
Konklusioner Mulige indikatorer Incidens af f rste bacter mi episode efter 6 m neder Incidens af alle episoder pr. patient/ r delt efter behandlingsmodalitet (HD,PD,RT) Mortalitet efter 1. episode (alle dialysepatienter) Behov for komorbiditetsjustering (alder, CCI, DM)?
Microbiology: First and Second Bacteraemia Fungus 1% Other 2% Fungus 3% Other 2% Gm- other 7% Gm- other 8% S. Aureus 17% Pseudomonas 2% S. Aureus 26% Pseudomonas 2% Klebsiella 6% Klebsiella 7% Enterobacter 3% Enterobacter 3% S. other 15% E. coli 15% E. coli 11% S. other 11% S. Uspec 8% Gm+ other 5% Gm+ other 6% S. Uspec 9% Streptococcus 7% Enterococcus 7% Streptococcus 6% Enterococcus 11%
Microbiology: Third and Fourth Bacteraemia Fungus 6% Other 0% Fungus 4% Other 0% S. Aureus 13% Gm- other 12% S. Aureus 21% Gm- other 10% Pseudomonas 2% Pseudomonas 4% S. other 16% Klebsiella 6% Klebsiella 8% Enterobacter 2% S. other 13% E. coli 7% Enterobacter 5% S. Uspec 7% Gm+ other 7% E. coli 8% S. Uspec 6% Streptococcus 7% Gm+ other 6% Streptococcus 4% Enterococcus 10% Enterococcus 16%
HD Access and Gram Type 16 14 AV 12 10 Perm tunnel % 8 Temp tunnel 6 Temporary Temporary 4 2 Temp tunnel 0 Perm tunnel Gram + Gram - AV Gram + Gram - Excess risk Annual rate HD only
6-month mortality after first bacteraemia by center All patients. 45 Range 21-42% 40 35 30 Excess Risk 20% Annual Rate 22% 25 % 20 6-month mortality 33% 15 10 5 0 1 2 3 4 5 6 7 8 9 10 11 12 13 14
6 month bacteraemia incidence by Center HD only, first bacteraemia episode only 30 Range 11-25% 25 20 % 15 10 5 0 1 2 3 4 5 6 7 8 9 10 11 12 13 14 Center
Bacteraemia incidence 2010-2014 by center HD only, all episodes 35 Range 14-32% 30 25 Denmark HD 21.3%/yr PD 7.6%/yr RT 5.6%/yr 20 % 15 10 5 0 1 2 3 4 5 6 7 8 9 10 11 12 13 14 Center
Planned vs. Unplanned PD 1,00 p<0.05 0,95 0,90 No excess risk Cumulative Proportion Surviving Planned PD 0,85 Planned 9%/yr Unplanned 13%/yr 0,80 Unplanned PD 0,75 0,70 0,65 P<0.01 0,60 0,0 0,5 1,0 1,5 2,0 2,5 3,0 3,5 4,0 4,5 5,0 Time (years)
Calculation of Excess risk and Annual Risk A= Event-free survival at 0.5 years B= Event-free survival at 2.5 years Annual rate (%) = (1- (B/A)) x 100 Excess risk (%) = (1 - (B/A)0.25) x 100