Explore the efficacy and safety of Bezlotoxumab through meta-analyses of observational studies. Analyze event rates, serious adverse events, and risk ratios to understand the impact of Bezlotoxumab in treating rCDI. Subgroup analysis delves into adverse effects like pyrexia and nausea when Bezlotoxumab is combined with actoxumab.
Please find below an Image/Link to download the presentation.
The content on the website is provided AS IS for your information and personal use only. It may not be sold, licensed, or shared on other websites without obtaining consent from the author. If you encounter any issues during the download, it is possible that the publisher has removed the file from their server.
You are allowed to download the files provided on this website for personal or commercial use, subject to the condition that they are used lawfully. All files are the property of their respective owners.
The content on the website is provided AS IS for your information and personal use only. It may not be sold, licensed, or shared on other websites without obtaining consent from the author.
E N D
Presentation Transcript
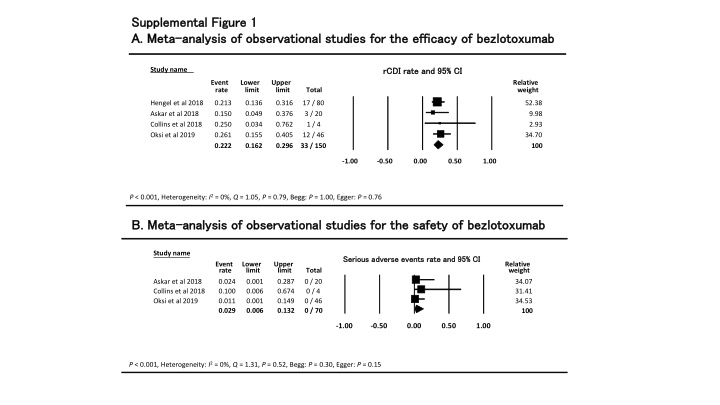
Supplemental Figure 1 Supplemental Figure 1 A. Meta A. Meta- -analysis of observational studies for the efficacy of analysis of observational studies for the efficacy of bezlotoxumab bezlotoxumab Event rate and 95% CI rCDI rCDI rate and 95% CI rate and 95% CI Study name Event rate Lower limit Upper limit Relative weight Total Hengel et al 2018 Askar et al 2018 Collins et al 2018 Oksi et al 2019 0.213 0.150 0.250 0.261 0.222 0.136 0.049 0.034 0.155 0.162 0.316 0.376 0.762 0.405 0.296 17 / 80 3 / 20 1 / 4 12 / 46 33 / 150 52.38 9.98 2.93 34.70 100 -1.00 -0.50 0.00 0.50 1.00 Favours A Favours B P < 0.001, Heterogeneity: I2= 0%, Q = 1.05, P = 0.79, Begg: P = 1.00, Egger: P = 0.76 B. Meta B. Meta- -analysis of observational studies for the safety of analysis of observational studies for the safety of bezlotoxumab bezlotoxumab Study name Serious Serious adverse adverse events events rate rate and 95% CI and 95% CI Event rate 0.024 0.100 0.011 0.029 Lower limit 0.001 0.006 0.001 0.006 Upper limit 0.287 0.674 0.149 0.132 Relative weight 34.07 31.41 34.53 Total 0 / 20 0 / 4 0 / 46 0 / 70 Askar et al 2018 Collins et al 2018 Oksi et al 2019 100 -1.00 -0.50 0.00 0.50 1.00 P < 0.001, Heterogeneity: I2= 0%, Q = 1.31, P = 0.52, Begg: P = 0.30, Egger: P = 0.15
Supplemental Figure 2 Supplemental Figure 2 Meta Meta- -analysis of randomized controlled trials analysis of randomized controlled trials (Mantel (Mantel- -Haenszel Haenszel Risk Ratio) Risk Ratio) rCDI / Total 95% CI Study name MH risk ratio and 95% CI Drug MH risk ratio Lower limit Upper limit Relative weight Treated Control Wilcox et al 2017 (MODYFY I) 0.937 0.715 1.228 60 / 232 109 / 395 95.52 Actoxumab Leav et al 2010 0.977 0.266 3.585 5 / 29 3 / 17 4.48 0.939 0.721 1.223 65 / 261 112 / 412 100 P = 0.64, Heterogeneity: I2= 0%, Q = 0.004, P = 0.95 0.01 0.1 1 10 100 MH risk Lower Upper ratio limit Relative weight limit Treated Control Wilcox et al 2017 (MODIFY I) Wilcox et al 2017 (MODIFY II) Lowy et al 2010 0.577 0.580 0.274 0.545 0.436 0.432 0.124 0.448 0.764 0.777 0.605 0.663 61 / 383 58 / 390 7 / 101 126 / 874 109 / 395 97 / 378 25 / 99 231 / 872 46.44 42.63 10.93 100 Actoxumab + Bezlotoxumab 0.01 0.1 1 10 100 P < 0.001, Heterogeneity: I2= 37.9%, Q = 3.22, P = 0.20, , Begg: P = 1.00, Egger: P = 0.040 MH risk Lower ratio Upper limit Relative weight limit Treated Control Wilcox et al 2017 (MODYFY I) 0.629 0.480 0.824 67 / 386 109 / 395 52.08 Bezlotoxumab Wilcox et al 2017 (MODYFY II) 0.612 0.460 0.814 62 / 395 97 / 378 47.92 0.621 0.510 0.755 129 / 781 206 / 773 100 0.01 0.1 1 10 100 P < 0.001, Heterogeneity: I2= 0%, Q = 0.019, P = 0.89 Anti-toxin antibody Placebo
Supplemental Figure Supplemental Figure 3 3 A. Subgroup analysis in adverse effects of A. Subgroup analysis in adverse effects of bezlotoxumab bezlotoxumab plus plus actoxumab actoxumab C. Pyrexia A. Nausea Study name 95% CI Events / Total Risk ratio and 95% CI Study name 95% CI Events / Total Risk ratio and 95% CI Risk ratio Lower limit Upper limit Relative weight Treated Control Risk ratio Lower limit Upper limit Relative weight Treated Control Wilcox et al 2017 (MODIFY I) 0.965 0.472 1.972 14 / 387 15 / 400 87.13 Wilcox et al 2017 (MODIFY I) 1.100 0.688 1.760 33 / 387 31 / 400 68.23 Wilcox et al 2017 (MODIFY II) 1.954 0.178 21.458 2 / 390 1 / 381 7.75 Wilcox et al 2017 (MODIFY II) 1.278 0.629 2.594 17 / 390 13 / 381 30.04 Lowy et al 2010 0.140 0.007 2.677 0 / 101 3 / 99 5.11 Lowy et al 2010 6.863 0.359 131.162 3 / 101 0 / 99 1.73 100 0.923 0.474 1.799 16 / 878 19 / 880 100 1.188 0.806 1.751 53 / 878 44 / 880 0.01 0.1 1 10 100 P = 0.39, Heterogeneity: I2= 0%, Q = 1.50, P = 0.47 0.01 0.1 1 10 100 P = 0.81, Heterogeneity: I2= 0%, Q = 1.96, P = 0.38 Anti-toxin antibody Placebo Placebo Anti-toxin antibody D. Diarrhea Study name B. Vomiting 95% CI Events / Total Risk ratio and 95% CI Study name 95% CI Events / Total Risk ratio and 95% CI Risk ratio Lower limit Upper limit Relative weight Treated Control Risk ratio Lower limit Upper limit Relative weight Treated Control Wilcox et al 2017 (MODIFY I) 1.222 0.785 1.900 39 / 387 33 / 400 31.70 Wilcox et al 2017 (MODIFY I) 0.973 0.499 1.898 16 / 387 17 / 400 94.49 Wilcox et al 2017 (MODIFY II) 0.760 0.437 1.320 21 / 390 27 / 381 24.82 Wilcox et al 2017 (MODIFY II) 0.977 0.061 15.562 1 / 390 1 / 381 5.51 Lowy et al 2010 0.700 0.521 0.942 40 / 101 56 / 99 43.48 100 0.852 0.598 1.215 100 / 878 116 / 880 0.973 0.508 1.863 17 / 777 18 / 781 100 0.01 0.1 1 10 100 P = 0.93, Heterogeneity: I2= 0%, Q < 0.001, P = 1.00 0.01 0.1 1 10 100 P = 0.38, Heterogeneity: I2= 53.4%, Q = 4.29, P = 0.12 Anti-toxin antibody Placebo Anti-toxin antibody Placebo
Supplemental Figure Supplemental Figure 3 3 B. Subgroup analysis in adverse effects of B. Subgroup analysis in adverse effects of bezlotoxumab bezlotoxumab monotherapy monotherapy A. Nausea C. Pyrexia Study name Study name 95% CI Events / Total 95% CI Events / Total Risk ratio and 95% CI Risk ratio and 95% CI Risk ratio Lower limit Upper limit Relative weight Risk ratio Lower limit Upper limit Relative weight Treated Control Treated Control Wilcox et al 2017 (MODIFY I) 1.641 0.874 3.081 24 / 390 15 / 400 95.08 Wilcox et al 2017 (MODIFY I) 1.059 0.659 1.700 32 / 390 31 / 400 62.60 Wilcox et al 2017 (MODIFY II) 0.962 0.060 15.327 1 / 396 1 / 381 4.92 Wilcox et al 2017 (MODIFY II) 1.702 0.875 3.311 23 / 396 13 / 381 37.40 1.598 0.865 2.954 25 / 786 16 / 781 100 1.265 0.806 1.984 55 / 786 44 / 781 100 P = 0.13, Heterogeneity: I2= 0%, Q = 0.14, P = 0.71 0.01 0.1 1 10 100 0.01 0.1 1 10 100 P = 0.31, Heterogeneity: I2= 23.0%, Q = 1.30, P = 0.26 Anti-toxin antibody Placebo Anti-toxin antibody Placebo B. Vomiting D. Diarrhea Study name 95% CI Events / Total Risk ratio and 95% CI Study name 95% CI Events / Total Risk ratio and 95% CI Risk ratio Lower limit Upper limit Relative weight Risk ratio Lower limit Upper limit Relative weight Treated Control Treated Control Wilcox et al 2017 (MODIFY I) 1.057 0.668 1.671 34 / 390 33 / 400 57.37 Wilcox et al 2017 (MODIFY I) 1.388 0.753 2.557 23 / 390 17 / 400 93.89 Wilcox et al 2017 (MODIFY II) 0.855 0.503 1.455 24 / 396 27 / 381 42.63 Wilcox et al 2017 (MODIFY II) 1.924 0.175 21.134 2 / 396 1 / 381 6.11 100 0.966 0.682 1.366 58 / 786 60 / 781 1.416 0.783 2.559 25 / 786 18 / 781 100 0.01 0.1 1 10 100 0.01 0.1 1 10 100 P = 0.25, Heterogeneity: I2= 0%, Q = 0.067, P = 0.80 P = 0.84, Heterogeneity: I2= 0%, Q = 0.35, P = 0.56 Placebo Anti-toxin antibody Placebo Anti-toxin antibody