Analysis of Drug Overdose Death Rates and Trends
This content delves into the alarming statistics related to drug overdose deaths in the United States, focusing on the epidemic's impact on different states as well as nationally. Detailed data on death rates, comparisons with other causes of mortality, and trends over several years are presented, shedding light on the severity of the crisis. The information is sourced from reputable publications and visualized through graphs and images.

Download Presentation

Please find below an Image/Link to download the presentation.
The content on the website is provided AS IS for your information and personal use only. It may not be sold, licensed, or shared on other websites without obtaining consent from the author.If you encounter any issues during the download, it is possible that the publisher has removed the file from their server.
You are allowed to download the files provided on this website for personal or commercial use, subject to the condition that they are used lawfully. All files are the property of their respective owners.
The content on the website is provided AS IS for your information and personal use only. It may not be sold, licensed, or shared on other websites without obtaining consent from the author.
E N D
Presentation Transcript
Recipients Meeting August 29, 2017 Annaliese Mayette, Drug Epidemiologist
Source: NY Times, Short Answers to Hard Questions About the Opioid Crisis, August 3, 2017 (retrieved on 4 august, 2017 from https://www.nytimes.com/interactive/2017/08/03/upshot/opioid-drug-overdose-epidemic.html) The US rate was roughly 2 percent in 2015
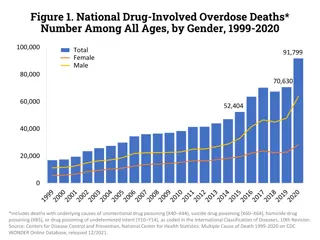
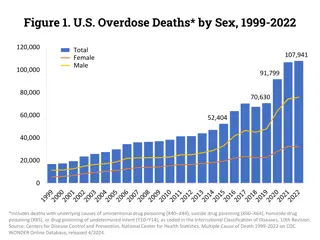
Overdoses killed more people last year than guns or car accidents, and are doing so at a pace faster than the H.I.V. epidemic at its peak. In 2015, roughly 2 percent of deaths one in 50 in the United States were drug-related. Source: NY Times, Short Answers to Hard Questions About the Opioid Crisis, August 3, 2017 (retrieved on 4 august, 2017 from https://www.nytimes.com/interactive/2017/08/03/upshot/opioid-drug-overdose-epidemic.html)
Drug Overdose Death Rates Leading States, U.S., 2015 Rank 1 2 3 4 5 6 7 8 State West Virginia New Hampshire Kentucky Ohio Rhode Island Pennsylvania Massachusetts New Mexico U.S. Deaths per 100,000 41.5 34.3 29.9 29.9 28.2 26.3 25.7 25.3 16.3 Sources: CDC Wonder Rates are age-adjusted to the 2000 US Standard Population.
Drug Overdose Death Rates New Mexico and United States, 1990-2016 30 Deaths per 100,000 persons New Mexico 25 24.8 United States 20 15 16.3 7.7 10 5 3.4 0 1990 1992 1993 1994 1995 1996 1997 1998 1999 2000 2001 2002 2003 Year 2004 2005 2007 2008 2009 2010 2011 2012 2013 2014 2015 2016 1991 2006 Rates are age adjusted to the US 2000 standard population Source: United States (CDC Wonder); New Mexico (NMDOH BVRHS/SAES, 1990-1998,2016 ; NM-IBIS, 1999-2015)
Drug Overdose Death Rate by County, NM 2012-2016 100 Deaths per 100,000 population 90 80 70 60 50 40 30 20 10 0 New Mexico Rio Arriba Bernalillo Los Alamos San Miguel Roosevelt Guadalupe McKinley San Juan Valencia Dona Ana Santa Fe Sandoval Torrance Lincoln Socorro De Baca Hidalgo Harding Chaves Cibola Catron Colfax Sierra Union Curry Otero Grant Mora Taos Quay Luna Eddy Lea Rates are age adjusted to the US 2000 standard population Source: Bureau of Vital Records and Health Statistics, UNM/GPS population estimates 6
Drug Overdose Death Rate by Age Group, New Mexico, 2012-2016 60 Deaths per 100,000 population 50 40 30 20 10 0 0-4 5-14 15-24 25-34 35-44 45-54 55-64 65-74 75-84 85+ Source: Bureau of Vital Records and Health Statistics death data; UNM/GPS population estimates
Drug Overdose Death Rate by Sex, NM, 2012-2016 40 35 Deaths per 100,000 population 30 25 20 15 10 5 0 2012 2013 2014 2015 2016 Male Female Rates are age adjusted to the US 2000 standard population Source: Bureau of Vital Records and Health Statistics death data; UNM/GPS population estimates
Drug Overdose Death Rate by Race/Ethnicity, New Mexico, 2012-2016 White 23.6 Hispanic 26.9 Black 22.6 Asian/Pacific Islander 5.7 American Indian 15.7 0 5 10 Deaths per 100,000 population 15 20 25 30 Rates are age adjusted to the US 2000 standard population Source: Bureau of Vital Records and Health Statistics death data; UNM/GPS population estimates
All Opioid Drug Overdose Death Rate by Age, New Mexico, 2012-2016 40 Deaths per 100,000 population 35 30 25 20 15 10 5 0 0-4 5-14 15-24 25-34 35-44 45-54 55-64 65-74 75-84 85+ Source: Bureau of Vital Records and Health Statistics death data; UNM/GPS population estimates
All Opioid Drug Overdose Death Rate by Age and Sex, New Mexico, 2012-2016 50 45 Male Female Deaths per 100,000 population 40 35 30 25 20 15 10 5 0 0-4 5-14 15-24 25-34 35-44 45-54 55-64 65-74 75-84 85+ Source: Bureau of Vital Records and Health Statistics death data; UNM/GPS population estimates
Drug Overdose Death Rates for Selected Drugs, NM, 1990-2016 14 Deaths per 100,000 population 12 10 8 6 4 2 0 1990 1991 1993 1994 1995 1996 1997 1998 1999 2000 2001 2002 2003 2004 2005 2006 2007 2008 2009 2010 2011 2012 2013 2014 2015 1992 2016 Rx Opioids Heroin Benzodiazepines Methamphetamine Alcohol Cocaine 2016 data as of 5/5/17 Drug categories are not mutually exclusive Rates are age adjusted to the US 2000 standard population Source: Office of the Medical Investigator, UNM/GPS population estimates
Opioid Sales to Pharmacies in Total MME and Drug Overdose Death Rate, NM 2001 - 2016 30 8 25 Total MME per 100,000 population 6 Deaths per 100,00 population 20 5 15 3 10 2 5 0 0 2001 2002 2003 2004 2005 2006 2007 2008 2009 2010 2011 2012 2013 2014 2015 2016 MME Overdose deaths Source: DEA ARCOS data, Bureau of Vital Records and Health Statistics death data; UNM/GPS population
Opioid Sales to Pharmacies by Drug in Total MME, NM 2001-2016 800,000,000 700,000,000 600,000,000 500,000,000 Total MME 400,000,000 300,000,000 200,000,000 100,000,000 0 2001 2002 2003 2004 2005 2006 2007 2008 2009 2010 2011 2012 2013 2014 2015 2016 OXYCODONE BUPRENORPHINE FENTANYL BASE HYDROCODONE MORPHINE METHADONE HYDROMORPHONE OXYMORPHONE MEPERIDINE (PETHIDINE) Source: DEA ARCOS Data
Top Rx Drugs in Overdose Death, NM 2016 oxycodone alprazolam fentanyl hydrocodone methadone diazepam morphine tramadol zolpidem 0 20 40 60 80 100 120 Overdose death involvements Deaths may involve more than one drug Source: NM Office of the Medical Investigator
Patients and Prescriptions
Number of Controlled Substance Prescriptions Filled by Drug Type, NM, 2016 Opioids Benzodiazepines Stimulants Barbiturates Muscle Relaxants Other Number of prescriptions filled Source: New Mexico Prescription Monitoring Program
High Dose Prescriptions (90 MME/day) by Year, New Mexico, 2009-2016 25% Percent of all opioid prescriptions 19% 20% 20% 17% 15% 14% 14% 14% 13% 15% 10% 5% 0% 2009 2010 2011 2012 2013 2014 2015 2016 Prescriptions for buprenorphine/naloxone excluded Source: NM Prescription Monitoring Program
Patients with Concurrent Prescriptions for Opioids and Benzodiazepines, NM 2014-2017Q1 35,000 30,000 25,000 Patients 20,000 15,000 10,000 5,000 0 Patients with at least 10 days of concurrent prescriptions in 3 months Source: NM Prescription Monitoring Program
Patients with Overlapping Opioid Prescriptions, NM 2014-2017Q1 7,000 6,000 5,000 Patients 4,000 3,000 2,000 1,000 0 Patients with at least 10 days of overlapping prescriptions from different prescribers Source: NM Prescription Monitoring Program
Multiple Provider Patients, NM 2014-2017Q1 6,000 5,000 4,000 Patients 3,000 2,000 1,000 0 Patients who received prescriptions from 4+ prescribers or filled prescriptions at 4+ pharmacies in 3 months Source: NM Prescription Monitoring Program
Total Morphine Milligram Equivalents of Opioids Dispensed by Treatment Use, NM 2006-2016 2,000,000,000 1,500,000,000 Total MME Dispensed 1,000,000,000 Non-treatment Treatment 500,000,000 0 2006 2007 2008 2009 2010 2011 2012 2013 2014 2015 2016 Buprenorphine/naloxone combinations are assumed to be used for treatment Source: New Mexico Prescription Monitoring Program
Buprenorphine/Naloxone Patients, NM, 2014-2017Q1 6,000 5,000 4,000 Patients 3,000 2,000 1,000 0 Based on patients with at least 10 days of coverage Source: NM Prescription Monitoring Program
Treatment (Buprenorphine/Naloxone) Prescribers with at least 10 Treatment Patients, 2016-2017 120 110 109 108 100 102 99 80 Prescribers 60 40 20 - 2016Q1 2016Q2 2016Q3 2016Q4* 2017Q1 Source: NM Prescription Monitoring Program
PMP Requests
Percent of New Opioid Patients With a PMP Check, New Mexico, 2014-2017Q1 16% 14% Percent of patients 12% 10% 8% 6% 4% 2% 0% Patients with >4 days of opioid coverage in the quarter and no more than 4 days of opioid coverage in the prior quarter; PMP checks by any practitioner. Some PMP usage data are missing for 2016Q4 due to system conversion Source: NM Prescription Monitoring Program
Percent of Chronic Opioid Patients with a PMP Check by a Practitioner in the Past 3 Months, NM, 2014-2017Q1 60% 50% 40% 30% 20% 10% 0% Chronic patients are those with at least 90 days of coverage in the past 6 months Missing data in 2016Q4 due to system conversion Source: NM Prescription Monitoring Program
Percent of Patients with No PMP Review by Opioid Use Category, NM, 2016 100% 90% Percent without PMP requests 76% 80% 60% 40% 40% 24% 20% 0% One prescription < 90 days 1-year opioid use category 90-330 days Full time Source: NM Prescription Monitoring Program
Neonatal Abstinence Syndrome
Neonatal Abstinence Syndrome, NM (2000-2015) & US (2000-2012) Sources: US: Weighted national estimates from HCUP Nationwide Inpatient Sample (NIS), 2000, Agency for Healthcare Research and Quality (AHRQ), based on data collected by individual States and provided to AHRQ by the States. Total number of weighted discharges in the U.S. based on HCUP NIS = 36,417,565. New Mexico: 2000-2015 Hospital Inpatient Discharge Data (HIDD).
Instances* of Naloxone Distribution and Drug Overdose Reversals 2016 2017 - First Half Distributions Distributions Reported Reversals^ Reported Reversals^ New Mexico 4578 1728 818 351 Data Sources: NMDOH, BHSD-Southwest CARE Center Project, Medicaid *Instances are defined as occasions on which a person got naloxone. These are not individual-level data as one person could have gotten naloxone more than once and from more than one of the sources used for this count. (Harm Reduction Data are as of August 11, 2017) **Data do not reflect all instances of distribution due to late reporting as well as paid-out-of-pocket and private insurance naloxone coverage ^Reported Reversals are not necessarily individual level data, as one person could have overdosed and been reversed more than once
Instances* of Naloxone Distribution by County of Service (Distribution) and Average Drug Overdose Death Numbers by County of Residence (2016 & 2017 Instances) County of Service (Distribution) distribution in 2016 distribution in 2017 (through June 2017) Instances of naloxone Instances of naloxone Average number of drug overdose deaths per year, 2012-2016 1 Ratio of naloxone(2017 through June)/deaths 0.0 Catron Cibola De Baca Guadalupe Harding Luna Mora Union Curry Torrance Sierra Grant San Juan Otero Lincoln Hidalgo 0 16 0 0 0 7 4 0 6 2 15 10 22 5 19 2 0 0 0 0 0 0 0 0 1 1 1 4 11 7 4 1 5 0 2 0 3 1 0 6 4 4 8 0.0 0.0 0.0 0.0 0.0 0.0 0.0 0.2 0.3 0.3 0.5 0.5 0.5 0.6 0.6 21 13 7 2
Instances* of Naloxone Distribution by County of Service (Distribution) and Average Drug Overdose Death Numbers by County of Residence (2016 & 2017 Instances) County of Service (Distribution) distribution in 2016 distribution in 2017 (through June 2017) Instances of naloxone Instances of naloxone Average number of drug overdose deaths per year, 2012-2016 Ratio of naloxone(2017 through June)/deaths Rio Arriba McKinley Roosevelt 202 81 1 31 15 6 32 9 3 25 1.0 1.7 2.0 2.0 Sandoval Valencia 72 52 51 39 17 33 2.3 2.4 Dona Ana 254 80 11 2.6 Eddy Lea Los Alamos New Mexico Taos Chaves 28 200 11 4578 67 39 30 16 9 1728 38 46 5 3 3.2 3.5 3.5 3.9 3.9 493 10 12
Instances* of Naloxone Distribution by County of Service (Distribution) and Average Drug Overdose Death Numbers by County of Residence (2016 & 2017 Instances) County of Service (Distribution) distribution in 2016 distribution in 2017 (through June 2017) Instances of naloxone Instances of naloxone Average number of drug overdose deaths per year, 2012-2016 Ratio of naloxone(2017 through June)/deaths 4 4.0 Colfax 25 16 2 4.2 Quay 7 10 185 4.3 Bernalillo 1783 792 3 4.4 Socorro 2 14 11 4.4 San Miguel 123 48 45 10.2 Santa Fe 1521 455 Data Sources: NMDOH-Harm Reduction Program, BHSD-Southwest CARE Center Project, Medicaid *Instances are defined as occasions in which naloxone was provided to an individual. These are not individual-level data as one person could have gotten naloxone more than once and from more than one of the sources used for this count (data reported as of: June 2017) **Data do not reflect all instances of distribution due to late/missing reports as well as purchases covered by private insurance or paid out of pocket. ***Harm reduction data as of 08/11/2017
Thank You Contacts: NMDOH Substance Abuse Epi Website: https://nmhealth.org/about/erd/ibeb/sap/ Annaliese Mayette Annaliese.Mayette@state.nm.us SA list serve contact: Rosa Lopez Rosa.Lopez@state.nm.us Ihsan Mahdi Ihsan.mahdi@state.nm.us Laura Tomedi Laura.Tomedi@state.nm.us


 by Year,")


 Prescribers")