Analysis of ERCC1 and TYMS mRNA Expression in Relation to Survival and Treatment Arms
Download Presenatation

Explore the interaction between treatment arms and ERCC1/TYMS mRNA expression levels concerning overall survival (OS) and progression-free survival (PFS). Multivariate analyses and SNPs of ERCC1, XRCC1, and GSTP1 are also discussed as prognostic and predictive factors in gastric cancer patients. Discover key findings from tables detailing HR, 95% CI values, gene variations, and treatment outcomes.

Download Presentation
Please find below an Image/Link to download the presentation.
The content on the website is provided AS IS for your information and personal use only. It may not be sold, licensed, or shared on other websites without obtaining consent from the author. If you encounter any issues during the download, it is possible that the publisher has removed the file from their server.
You are allowed to download the files provided on this website for personal or commercial use, subject to the condition that they are used lawfully. All files are the property of their respective owners.
The content on the website is provided AS IS for your information and personal use only. It may not be sold, licensed, or shared on other websites without obtaining consent from the author.
E N D
Presentation Transcript
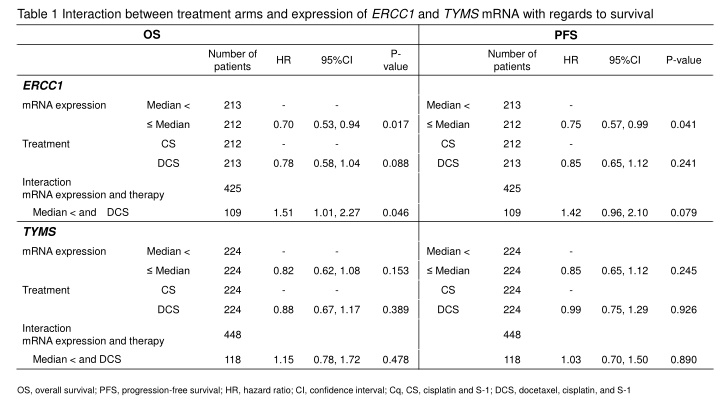
Table 1 Interaction between treatment arms and expression of ERCC1 and TYMS mRNA with regards to survival OS PFS Number of patients P- Number of patients HR 95%CI HR 95%CI P-value value ERCC1 mRNA expression Median < 213 - - Median < 213 - 212 0.70 0.53, 0.94 0.017 212 0.75 0.57, 0.99 0.041 Median Median Treatment CS 212 - - CS 212 - DCS 213 0.78 0.58, 1.04 0.088 DCS 213 0.85 0.65, 1.12 0.241 Interaction mRNA expression and therapy 425 425 Median < and DCS 109 1.51 1.01, 2.27 0.046 109 1.42 0.96, 2.10 0.079 TYMS mRNA expression Median < 224 - - Median < 224 - 224 0.82 0.62, 1.08 0.153 224 0.85 0.65, 1.12 0.245 Median Median Treatment CS 224 - - CS 224 - DCS 224 0.88 0.67, 1.17 0.389 DCS 224 0.99 0.75, 1.29 0.926 Interaction mRNA expression and therapy 448 448 Median < and DCS 118 1.15 0.78, 1.72 0.478 118 1.03 0.70, 1.50 0.890 OS, overall survival; PFS, progression-free survival; HR, hazard ratio; CI, confidence interval; Cq, CS, cisplatin and S-1; DCS, docetaxel, cisplatin, and S-1
Table. 2 Multivariate analysis for overall survival and progression-free survival OS1 PFS2 95% CI4 Characteristic ERCC1 mRNA Low High ECOG PS Age 65 > 65 Sex Male Female No. of metastatic sites 0-1 2 Previous gastrectomy No Yes Measurable lesion No Yes Histology Differentiated adenocarcinoma Undifferentiated adenocarcinoma Peritoneal metastasis No Yes 1OS, overall survival; 2PFS, progression-free survival; 3HR, Hazard Ratio; 4CI, confidence interval HR3 95% CI4 P HR3 P 0.32 1.89 0.34 1.29 1.34 0.16, 0.63 1.20, 2.98 0.001 0.006 0.18, 0.63 0.85, 1.98 0.87, 2.05 <0.001 0.236 1.44 0.92, 2.26 0.114 0.179 1.13 0.98 0.69, 1.84 0.631 0.61, 1.55 0.920 1.50 1.46 0.91, 2.46 0.110 0.92, 2.31 0.107 1.01 1.38 0.60, 1.71 0.975 0.83, 2.29 0.215 0.92 0.52, 1.61 0.761 1.62 0.94, 2.77 0.080 0.94 0.93 0.57, 1.54 0.805 0.59, 1.46 0.738 1.72 2.15 0.93, 3.20 0.086 1.22, 3.80 0.008
Table 3 ERCC1 SNPs and mRNA as prognostic factors mRNA, Cq ratio OS PFS Allele N Gene rsID Mean SD HR 95%CI HR 95%CI GG/TG 42 0.142 0.342 Ref. Ref. ERCC1 3212980 TT 82 0.040 0.142 1.331 0.880 2.014 1.345 0.913 1.981 CC/CT 93 0.094 0.268 Ref. Ref. 3212964 TT 31 0.017 0.020 1.259 0.809 1.958 1.533 1.007 2.333 AG/GG 113 0.086 0.254 Ref. Ref. 11615 AA 11 0.020 0.015 1.175 0.609 2.266 0.777 0.406 1.489 CC/GC 113 0.086 0.254 Ref. Ref. 3212948 GG 11 0.020 0.015 1.175 0.609 2.266 0.777 0.406 1.489 CA/CC 95 0.096 0.270 Ref. Ref. 2298881 AA 29 0.016 0.019 1.330 0.845 2.092 1.525 0.994 2.340 TC/CC 117 - - Ref. Ref. XRCC1 rs25487 TT 7 - - 1.024 0.448 2.341 1.671 0.773 3.611 GA/GG 109 - - Ref. Ref. rs1799782 AA 15 - - 0.762 0.384 1.512 0.956 0.526 1.740 AG/AA 118 - - Ref. Ref. GSTP1 rs1695 GG 6 - - 1.728 0.751 3.978 2.336 1.016 5.368 High value of Cq ratio, threshold cycle ERCC1/ -actin, means low ERCC1 expression. OS, overall survival; PFS, progression-free survival; RR, response rate; SD, standard deviation; P, p-value; HR, hazard ratio; Ref., reference; CI, confidence interval
Table 4 SNPs of ERCC1, XRCC1, and GSTP1 as predictive factors OS PFS Gene rsID Allele N Comparison HR 95%CI HR 95%CI ERCC1 3212980 GG/TG TT CC/CT TT AG/GG AA CC/GC GG CA/CC AA TC/CC TT GA/GG AA AG/AA GG 42 82 93 31 113 11 113 11 95 29 117 7 109 15 118 6 DCS vs CS 0.255 0.704 0.469 0.812 0.493 0.807 0.493 0.807 0.501 0.691 0.517 0.572 0.576 0.237 0.532 4.472 0.113 0.437 0.295 0.368 0.325 0.191 0.325 0.191 0.318 0.302 0.346 0.060 0.382 0.048 0.355 0.279 0.578 1.132 0.747 1.790 0.746 3.416 0.746 3.416 0.789 1.580 0.775 5.437 0.869 1.162 0.796 71.807 0.429 0.689 0.562 0.667 0.519 1.251 0.519 1.251 0.557 0.685 0.561 1.724 0.599 0.325 0.588 0.592 0.220 0.439 0.365 0.314 0.352 0.309 0.352 0.309 0.363 0.313 0.383 0.284 0.405 0.095 0.402 0.062 0.838 1.082 0.865 1.417 0.767 5.067 0.767 5.067 0.854 1.503 0.821 10.465 0.888 1.116 0.860 5.654 3212964 11615 3212948 2298881 XRCC1 25487 DCS vs CS 1799782 GSTP1 1695 DCS vs CS OS, overall survival; PFS, progression-free survival; RR, response rate; PD. Progressive disease; SD, standard deviation; Est., estimated; Ref., reference; CI, confidence interval


