Analysis of Load Reductions in Transmission Charges and Price-Responsive Load
Explore the insights from the analysis of load reductions associated with 4-CP transmission charges and price-responsive load in the retail market. This update covers summer 2019 analysis, system-level data, ESIIDs/NOIEs breakdown, and category-wise load reductions. Stay informed on the impact of ERCTO load price responses and retail DR strategies.
Uploaded on | 2 Views
Download Presentation

Please find below an Image/Link to download the presentation.
The content on the website is provided AS IS for your information and personal use only. It may not be sold, licensed, or shared on other websites without obtaining consent from the author. If you encounter any issues during the download, it is possible that the publisher has removed the file from their server.
You are allowed to download the files provided on this website for personal or commercial use, subject to the condition that they are used lawfully. All files are the property of their respective owners.
The content on the website is provided AS IS for your information and personal use only. It may not be sold, licensed, or shared on other websites without obtaining consent from the author.
E N D
Presentation Transcript
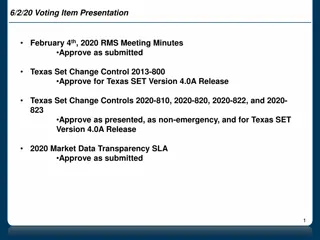
Analysis of Load Reductions Associated with 4-CP Transmission Charges and Price Responsive Load/Retail DR Carl L Raish Principal Load Profiling and Modeling Retail Market Subcommittee March 3, 2020
Overview Summer 2019 Analysis Update Updates to Commission Filing Total System-level DR Re-constituted ERCOT Load Price Response and Retail DR 4CP Response Block and Index Pricing (BI) Real Time Pricing (RTP) NOIE Price Response Peak Rebate (PR) Other Load Control (OLC) Time of Use (TOU) Other Voluntary DR (OTH) 2 PUBLIC
Summer 2019 Analysis Update Includes ERS-10 reductions for Aug 13; WS-ERS for both Aug 13 & 15. Corrections to properly include ERCOT-read SOG For ESIIDs known to be associated with SOG exclude day with export from baseline calculations for the ESIID ERCOT has modified and posted the TDSP Read Generator form to include ESIID associated with the Resource Id and will do a mass update for previous submissions This will allow allocation of response to SOGs rather than treating the it as load response NOIE 4CP baselines failed to exclude high price days from baseline calculations Day-of-adjustment window for NOIE 4CP baselines moved to exclude high price intervals 3 PUBLIC
Load Reductions by Category/System Level HE 17:00 MW Reductions Direct Load Control Total System DR 4CP 4CP NOIE NOIE PR Peak Rebate Competitive ERS Load Category Total Date Day Type BI RTP TDSP SOP Overlap Competitive 12-Aug 4CP, High Prices 2,555 1,059 1,235 573 126 1,219 - 2 159 4,373 1,818 EEA1, Near CP, High Prices Near CP, High Prices EEA1, Near CP, High Prices 13-Aug 3,384 1,223 1,639 758 119 1,634 143 2 455 19 5,992 2,608 14-Aug 1,347 561 642 281 83 629 2,196 849 15-Aug 2,239 960 845 578 106 788 - 2 515 3,794 1,555 16-Aug High Prices 1,148 492 63 499 92 2 1,148 - Total System DR: Amount of reduction with no double counting: 1. For an ESIID participating in more than one category 2. For a NOIE classified as responding to both price and 4CP 4 PUBLIC
ESIIDs/NOIEs by Category/System Level HE 17:00 ESIIDs / NOIEs with Reductions Total System DR (ESIIDs/ NOIEs) Category Total (ESIIDs/N OIEs) 4CP Direct Load Control Overlap (ESIIDs/ NOIEs) Day Type 4CP NOIE Peak Rebate Competitive ERS LOAD TDSP SOP Date Competi tive BI RTP NOIE PR 4CP, High Prices EEA1, Near CP, High Prices Near CP, High Prices EEA1, Near CP, High Prices 45,078 34 46,109 51 1,013 17 12-Aug 2,899 27 14,245 14,828 24 505 1,098 12,534 294,107 32 296,504 49 2,345 17 13-Aug 3,107 25 14,767 13,338 24 249,894 985 14,314 99 29,380 27 30,047 41 620 14 14-Aug 2,871 21 14,796 12,358 20 22 45,711 27 47,170 42 1,434 15 15-Aug 2,690 22 15,359 12,914 20 462 1,278 14,467 High Prices 272,151 16 272,152 16 1 0 16-Aug 14,389 15,129 16 241,646 988 Total System DR: Number responding with no double counting: 1. For an ESIID participating in more than one category 2. For a NOIE classified as responding to both price and 4CP 5 PUBLIC
Responding ESIIDs and Reductions Responding ESIIDs Single Category Unique ESIIDs MW17 reduce Date 4CP BI RTP OLC Pk Rebate ERS TDSP SOP 12-Aug 13-Aug 14-Aug 15-Aug 16-Aug 1,993 1,895 2,194 1,585 - 13,758 14,133 14,349 14,824 14,389 14,649 13,154 12,220 12,747 15,129 991 981 669 248,836 241,645 505 12,758 13,754 - 12,189 44,085 291,795 29,454 44,394 272,150 544 733 367 546 650 38 22 213 - - - - 1,271 987 - Responding ESIIDs More than One Category Unique ESIIDs 1,078 3,138 1,577 MW17 reduce Date 4CP BI RTP OLC Pk Rebate ERS TDSP SOP 12-Aug 13-Aug 14-Aug 15-Aug 16-Aug 1,078 3,138 630 1,577 - 487 634 447 535 - 179 184 138 167 - 107 - - 345 61 - - - 716 931 308 771 - 4 1,058 - 249 - 1,556 - 713 - - 630 7 - - 6 PUBLIC
Responding NOIEs and Reductions Responding NOIEs Only 4CP or Price Date NOIEs MW 12-Aug 13-Aug 14-Aug 15-Aug 16-Aug 10 8 8 8 5 83 83 31 93 498 Responding NOIEs Both 4CP and Price Date NOIEs MW 12-Aug 13-Aug 14-Aug 15-Aug 16-Aug 24 24 19 19 1,213 1,637 641 829 - - 7 PUBLIC
Total System DR 8 PUBLIC
Total System DR Summer 2019 Max Inrerval Reduce 1,343 1,244 1,659 1,512 1,792 1,171 1,083 1,563 1,336 1,656 2,593 3,463 1,518 2,373 1,158 1,348 2,239 1,221 1,236 HE 17 Reduce Date Day_Type ESIIDs NOIEs 19-Jun 20-Jun 21-Jun 9-Jul 10-Jul 11-Jul 30-Jul 31-Jul 2-Aug 5-Aug 6-Aug 7-Aug 9-Aug 12-Aug 13-Aug 14-Aug 15-Aug 16-Aug 22-Aug 26-Aug 6-Sep 18-Sep 23-Sep cp_day near_cp_day near_cp_day near_cp_day near_cp_day near_cp_day cp_day/high_price_day near_cp_day near_cp_day/high_price_day near_cp_day/high_price_day near_cp_day/high_price_day near_cp_day near_cp_day/high_price_day cp_day/high_price_day near_cp_day/high_price_day near_cp_day/high_price_day near_cp_day/high_price_day high_price_day high_price_day near_cp_day cp_day/high_price_day near_cp_day near_cp_day/high_price_day 4,824 2,676 3,734 28,514 31,032 29,732 30,659 28,458 35,475 40,890 39,669 2,418 32,397 45,163 294,933 29,393 45,971 272,151 31,475 2,297 261,270 36,931 38,500 22 8 9 16 17 10 20 30 21 22 29 24 25 34 32 27 27 16 18 24 23 23 10 1,315 915 792 1,222 1,643 568 1,459 1,769 1,156 1,033 1,535 1,327 1,630 2,555 3,385 1,346 2,238 1,148 620 1,261 2,211 1,184 1,214 972 838 585 630 9 PUBLIC
Total System Demand Response 10 PUBLIC
Total System Demand Response 11 PUBLIC
Total System Demand Response 12 PUBLIC
Total System Demand Response 13 PUBLIC
Total System Demand Response 14 PUBLIC
Actual ERCOT Total Load + Total System DR August 12 16, 2019 15 PUBLIC
Re-Constituted ERCOT Load 16 PUBLIC
Re-Constituted ERCOT Load 17 PUBLIC
Re-Constituted ERCOT Load 18 PUBLIC
Re-Constituted ERCOT Load 19 PUBLIC
Re-Constituted ERCOT Load 20 PUBLIC
DR/PR Category Results 21 PUBLIC
4CP/NearCP Events 4CP Days NearCP Days CP CP HE 17 Reduce HE 17 Reduce Date ESIIDs NOIEs Interval Reduce 1,142 1,519 1,551 1,044 1,363 1,336 1,470 1,971 1,185 1,756 1,322 1,004 Date ESIIDs NOIEs Interval Reduce 1,274 1,288 2,319 1,955 20-Jun 21-Jun 9-Jul 10-Jul 11-Jul 31-Jul 2-Aug 5-Aug 6-Aug 7-Aug 9-Aug 13-Aug 14-Aug 15-Aug 26-Aug 18-Sep 23-Sep 2,676 3,734 2,508 3,052 2,245 2,415 2,937 2,620 2,797 2,418 3,098 3,107 2,871 2,690 2,302 2,428 3,035 8 9 915 792 606 776 19-Jun 30-Jul 12-Aug 6-Sep 2,305 2,622 2,899 2,969 22 18 27 19 1,269 1,308 2,295 1,943 13 14 8 25 17 19 24 24 20 25 21 22 24 18 10 1,124 1,500 466 1,587 1,034 848 1,366 1,327 1,468 2,862 1,203 1,805 1,261 1,042 1,101 452 862 NOIE 4CP Participation Residential Non-Residential 220,433 3,277 4CP Incentive 4CP Advise/control 2,692 803 931 22 PUBLIC
BI Pricing ESIID Participation Business 2014 2015 2016 14,371 2017 20,967 11,857 2018 27,153 19,457 2019 47,107 23,354 23,753 Total 6,794 9,534 3,512 6,022 3,282 Stayed on BI Gains Losses Loss Different Program Loss - Deenergized Loss - No Program Percent Increase 5,270 9,101 4,264 1,430 140 2,694 50.7% 9,110 2,514 137 211 2,166 45.9% 7,696 1,510 105 252 1,153 29.5% 3,799 1,045 239 2,515 73.5% 48 71 3,163 40.3% 23 PUBLIC
BI High Price Events Average Reduce Average Price $ $ $ $ $ $ $ $ $ 1,119 $ $ $ 1,855 $ 5,033 $ $ 5,233 $ $ $ $ $ 1,087 $ $ $ $ $ $ Date ESIIDs Max Reduce 7-Jun 19-Jun 9-Jul 10-Jul 11-Jul 15-Jul 30-Jul 31-Jul 2-Aug 5-Aug 6-Aug 9-Aug 12-Aug 13-Aug 14-Aug 15-Aug 16-Aug 21-Aug 22-Aug 29-Aug 6-Sep 18-Sep 23-Sep 24-Sep 25-Sep 26-Sep 16,736 2,016 14,295 16,167 14,439 4,425 15,241 13,610 17,800 21,556 20,328 14,903 14,245 14,767 14,796 15,359 14,389 16,509 15,543 13,648 14,023 18,211 19,453 10,608 9,417 2,606 267 45 371 508 192 84 513 366 355 372 396 448 578 783 343 597 510 218 267 177 748 293 423 116 104 41 249 25 324 489 173 78 377 284 268 290 327 309 454 528 266 422 420 212 239 174 599 259 329 77 88 39 399 217 375 306 383 414 550 318 602 589 913 747 829 252 761 241 542 620 395 347 304 24 PUBLIC
Real-Time Pricing ESIID Participation Business 2014 2015 2016 2017 14,689 10,154 2018 12,959 -11.8% 2019 26,063 18,573 101.1% Total 9,699 4,612 2,308 2,304 7,391 1,333 207 5,851 -52.4% 8,478 2,116 6,362 2,496 348 Stayed on RTP Gains Losses Loss Different Program Loss - Deenergized Loss - No Program Percent Increase 4,535 6,579 6,380 8,110 433 182 7,495 7,490 3,943 175 188 3,580 73.3% 5,469 514 234 4,721 87 2,061 83.8% Residential 2014 2015 2016 2017 2018 2019 15,567 14,629 Total 1,001 998 106 892 895 14 1,326 105 1,221 893 1,649 836 813 490 9,944 749 9,195 900 Stayed on RTP Gains Losses Loss Different Program Loss - Deenergized Loss - No Program Percent Increase 938 9,006 357 163 8,486 56.5% 16 16 861 32.9% 14 6 470 24.4% 69 10 821 6 875 -0.3% 503.0% 25 PUBLIC
RTP High Price Events Max Reduce Average Reduce Average Price $ $ $ $ $ $ $ $ 1,117 $ $ $ 1,854 $ 5,023 $ $ 5,233 $ $ $ $ $ 1,087 $ $ $ $ $ Date ESIIDs 7-Jun 9-Jul 10-Jul 11-Jul 15-Jul 30-Jul 31-Jul 2-Aug 5-Aug 6-Aug 9-Aug 12-Aug 13-Aug 14-Aug 15-Aug 16-Aug 21-Aug 22-Aug 29-Aug 6-Sep 18-Sep 23-Sep 24-Sep 25-Sep 12,653 12,016 11,806 13,164 4,739 13,084 12,466 14,973 16,900 16,514 14,366 14,828 13,338 12,358 12,914 15,129 15,770 15,488 13,607 14,915 16,395 16,259 6,147 6,371 57 98 119 54 32 88 50 57 80 67 89 127 125 98 108 64 73 81 59 101 76 75 19 28 50 91 113 47 29 63 42 48 67 56 74 96 87 79 74 56 70 66 55 77 68 50 17 25 428 374 306 383 414 550 318 602 568 912 746 829 252 760 241 530 616 395 368 26 PUBLIC
NOIE Price Response NOIEs did not report participation in BI or RTP, but did use other categories to respond to price. NOIE DR Participation Residential Non-Residential 1,529 171,509 440,643 Peak Rebate DLC Other 511 5,185 3,309 27 PUBLIC
NOIE High Price Events Max Reduce Average Reduce Average Price Date NOIEs 7-Jun 9-Jun 10-Jul 30-Jul 31-Jul 2-Aug 5-Aug 6-Aug 9-Aug 12-Aug 13-Aug 14-Aug 15-Aug 16-Aug 21-Aug 22-Aug 29-Aug 6-Sep 18-Sep 23-Sep 12 12 13 16 20 18 17 22 18 24 24 20 20 16 19 18 16 18 20 10 245 402 480 460 469 408 320 684 625 179 397 453 289 398 303 201 467 400 884 $ $ $ $ $ $ 1,117.0 $ 563.0 $ 688.0 $ 1,858.0 $ 5,039.0 $ 750.0 $ 5,233.0 $ 829.0 $ 253.0 $ 762.0 $ 242.0 $ 1,087.0 $ 523.0 $ 637.0 $ 358 374.0 305.0 550.0 318.0 602.0 1,254 1,682 802 1,042 500 290 317 441 892 559 351 1,241 677 499 385 279 292 415 671 491 161 28 PUBLIC
Peak Rebate ESIID Participation Business 2014 30,157 2015 32,286 24,091 2016 35,368 25,527 2017 40,612 29,277 11,354 2018 43,751 32,701 11,086 2019 45,206 35,201 Total Stayed on PR Gains Losses Loss Different Program Loss - Deenergized Loss - No Program Percent Increase 8,195 6,066 9,832 6,750 160 1,250 5,340 9.5% 9,992 8,537 186 1,634 6,717 3.3% 6,110 7,947 122 1,565 6,260 7.7% 85 46 1,227 4,754 7.1% 1,397 4,667 14.8% Residential 2014 408,217 2015 460,620 280,442 180,178 127,775 12,857 107,412 2016 476,501 305,376 171,134 155,253 29,957 118,389 2017 427,866 310,834 117,013 165,648 14,606 144,467 -10.2% 2018 442,517 304,901 137,580 122,929 17,927 99,272 2019 455,873 301,748 154,138 140,782 18,338 115,794 Total Stayed on PR Gains Losses Loss Different Program Loss - Deenergized Loss - No Program Percent Increase 7,506 6,907 6,575 5,730 6,650 12.8% 3.4% 3.4% 3.0% 29 PUBLIC
Peak Rebate Events HE 17 Reduce Max Reduce Average Reduce Average Price 5,026 $ $ $ 1,087 $ Date ESIIDs 13-Aug 249,894 16-Aug 241,646 21-Aug 6-Sep 228,959 145 94 14 35 145 94 14 35 118 66 14 21 829 252 43,294 Many summer events most had relatively small aggregate reductions: June 17 events July 14 August 18 September 16 30 PUBLIC
Direct Load Control ESIID Participation Business 2014 2015 2016 2017 2018 2019 Total 63 -85.7% 9 6 3 -33.3% 6 5 1 4 10 5 5 1 11 3 8 7 -36.4% 7 2 5 9 Stayed on OLC Gains Losses Loss Different Program Loss - Deenergized Loss - No Program Percent Increase 57 15 - - - - - - - - - 42 4 1 7 9 66.7% 10.0% Residential 2014 19,211 2015 14,898 -22.5% 2016 2017 2018 2019 Total 8,720 6,807 1,913 8,091 902 7,282 5,513 1,769 3,207 869 3,583 409 3,174 6,873 1,175 2,732 Stayed on OLC Gains Losses Loss Different Program Loss - Deenergized Loss - No Program Percent Increase 9,269 5,629 9,942 3,085 147 6,710 16 2,716 3,567 181 69 31 18 15 7,120 -41.5% 2,307 -16.5% 5,680 -50.8% 3,371 -23.8% 31 PUBLIC
Direct Load Control Events HE 17 Reduce Max Reduce Average Reduce Average Price 5,027 $ 5,233 $ $ 1,087 $ Date ESIIDs 13-Aug 15-Aug 16-Aug 6-Sep 985 2 2 2 1 3 3 3 3 1 1 1 2 1,278 988 1,146 829 Many summer events most had relatively small aggregate reductions: June 5 events July 11 August 12 September 5 32 PUBLIC
TOU ESIID Participation Business 2015 6,756 1,340 5,418 1,667 141 1,490 124.8% 2014 2016 2017 2018 2019 Total 3,005 4,914 3,249 1,652 3,494 155 215 3,124 -27.3% 3,911 2,927 984 1,987 112 165 1,710 -20.4% 1,699 1,106 586 2,798 148 121 2,529 -56.6% 1,758 925 830 771 Stayed on TOU Gains Losses Loss Different Program Loss - Deenergized Loss - No Program Percent Increase 36 46 73 652 3.5% Residential 2014 289,848 2015 321,504 164,732 156,770 125,114 109,696 2016 331,138 196,848 134,303 124,669 109,399 2017 408,561 204,609 203,952 126,529 112,345 2018 477,751 231,542 246,216 177,026 17,839 152,747 2019 584,669 276,451 308,221 201,303 13,687 179,511 Total Stayed on TOU Gains Losses Loss Different Program Loss - Deenergized Loss - No Program Percent Increase 9,957 5,461 9,923 5,347 9,092 5,092 6,440 8,105 10.9% 3.0% 23.4% 16.9% 22.4% NOIEs reported 3,053 Residential and 1,650 Non-residential customers on TOU 33 PUBLIC
Other ESIID Participation Business 2014 2015 2016 2017 2018 2019 Total 28 3 52 1 51 2 488 41 447 11 827 296 531 192 13 27 152 69.5% -99.3% 6 2 4 Stayed on OTH Gains Losses Loss Different Program Loss - Deenergized Loss - No Program Percent Increase - 3 28 825 23 40 762 1633.3% 1 1 838.5% 2 9 28 -89.3% Residential 2014 2015 2016 35,839 34,413 630.4% 2017 59,999 22,677 37,322 13,162 11,083 2018 234,514 32,186 202,328 27,813 22,323 290.9% 2019 Total 1,217 303.2% 4,907 234,514 27,409 203,247 -100.0% - - - Stayed on OTH Gains Losses Loss Different Program Loss - Deenergized Loss - No Program Percent Increase 1 1,426 4,906 1,216 3,481 168 60 15 1,716 363 4,898 592 72 3,858 1,141 3,241 67.4% 2018 programs discontinued 2019 REP 4CP programs NOIEs reported 440,643 Residential and 3,309 Non-residential customers 34 PUBLIC
Questions? ON OFF craish@ercot.com 512/248-3876 35 PUBLIC

