Analysis of Public Opinion on Single-Payer Health Care in the United States
Explore the evolving support for single-payer health care through public opinion polls over time, highlighting shifts in favor and opposition. Understand the impact of political affiliation, terminology, and proposed expansions in public health insurance programs on people's views.

Download Presentation

Please find below an Image/Link to download the presentation.
The content on the website is provided AS IS for your information and personal use only. It may not be sold, licensed, or shared on other websites without obtaining consent from the author. If you encounter any issues during the download, it is possible that the publisher has removed the file from their server.
You are allowed to download the files provided on this website for personal or commercial use, subject to the condition that they are used lawfully. All files are the property of their respective owners.
The content on the website is provided AS IS for your information and personal use only. It may not be sold, licensed, or shared on other websites without obtaining consent from the author.
E N D
Presentation Transcript
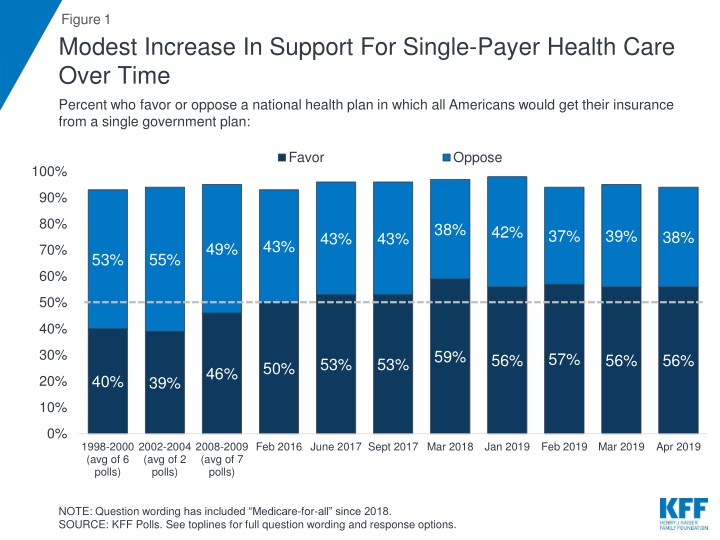
Figure 1 Modest Increase In Support For Single-Payer Health Care Over Time Percent who favor or oppose a national health plan in which all Americans would get their insurance from a single government plan: Favor Oppose 100% 90% 80% 38% 42% 37% 39% 38% 43% 43% 43% 49% 70% 53% 55% 60% 50% 40% 30% 59% 57% 56% 56% 56% 53% 53% 50% 46% 40% 20% 39% 10% 0% 1998-2000 (avg of 6 polls) 2002-2004 (avg of 2 polls) 2008-2009 (avg of 7 polls) Feb 2016 June 2017 Sept 2017 Mar 2018 Jan 2019 Feb 2019 Mar 2019 Apr 2019 NOTE: Question wording has included Medicare-for-all since 2018. SOURCE: KFF Polls. See toplines for full question wording and response options.
Figure2 Support For Federally-Provided Health Insurance Has Decreased Among Republicans Over Time Percent who say they favor the federal government doing more to help provide health insurance for more Americans: November 2006 September 2008 January 2019 85% 75% 74% Total 96% 92% 94% Democrats 86% 73% Independents 77% 72% 49% Republicans 40% SOURCE: KFF Polls. See toplines for full question wording and response options.
Figure3 Broad Support For Proposals To Expand Public Health Insurance Programs Percent who favor or oppose: Favor Oppose 100% 90% 24% 18% 18% 80% 42% 70% 60% 50% 40% 77% 75% 74% 30% 56% 20% 10% 0% Medicare-for-all Optional Medicare-for- all Medicaid buy-in Medicare buy-in for ages 50-64 SOURCE: KFF Health Tracking Poll (January 9-14, 2019). See topline for full question wording and response options.
Figure4 A Majority Of Republicans Strongly Oppose While A Majority Of Democrats Strongly Favor National Health Plan Do you favor or oppose having a national health plan, sometimes called Medicare-for-all, in which all Americans would get their insurance from a single government plan? Strongly favor Somewhat favor Somewhat oppose Strongly oppose 36% 20% 10% 28% Total By Political Party ID Democrats 54% 26% 7% 6% 31% 20% 15% 28% Independents 14% 13% 10% 57% Republicans SOURCE: KFF Health Tracking Poll (April 11-16, 2019). See topline for full question wording and response options.
Figure5 Terminology Affects Public Opinion On Single-Payer Do you have a positive or negative reaction to the following terms? Very/Somewhat positive Very/Somewhat negative No opinion 6% 63% 31% Universal health coverage 3% 63% 34% Medicare-for-all 5% 59% 36% National health plan 49% 32% Single-payer health insurance system 19% 46% 44% Socialized medicine 11% SOURCE: KFF Health Tracking Poll (April 11-16, 2019). See topline for full question wording and response options.
Figure6 Language Matters When Describing A National Health Plan Percent who say they have a positive reaction to each of the following terms: Total Republicans Independents Democrats 33% 62% 63% 87% Medicare-for-all Universal health coverage 63% 39% 83% 59% 34% 57% 59% 87% National health plan Single payer health insurance system 39% 47% 49% 64% Socialized medicine 17% 45% 46% 74% 0% 10% 20% 30% 40% 50% 60% 70% 80% 90% SOURCE: KFF Health Tracking Poll (April 11-16, 2019). See topline for full question wording and response options.
Figure7 Reasons For Opinions On National Health Plan Echo Partisan Messages AMONG THE 39% WHO OPPOSE: What is the main reason you oppose such a plan? Do you favor or oppose having a national health plan, sometimes called Medicare-for-all? AMONG THE 56% WHO FAVOR: What is the main reason you favor such a plan? NET: 40% Health care is a right 7% Don t want government involved 23% Universal coverage 34% Oppose 39% Favor 56% Too expensive to implement 14% DK/Ref. 5% Make health care more affordable/ Costs too high 17% Limits 14% choice/competition SOURCE: KFF Health Tracking Poll (March 13-18, 2019). See topline for full question wording and response options.
Figure8 Universal Coverage Is Most Important Feature Of A National Health Plan Among Supporters How importantis it that a national health plan ? Very important Somewhat important Not too important Not at all important 1% 89% 9% 1% Covers all Americans 1% 79% 18% 2% Simplifies the health care system 56% 33% 8% Eliminates monthly premiums 2% Eliminates out-of-pocket costs like co-pays and deductibles 56% 32% 8% 3% 45% 38% 8% Shifts what people pay for health care to taxes 6% 38% 29% 19% 11% Eliminates private health insurance companies NOTE: Among those who favor a national health plan. SOURCE: KFF Health Tracking Poll (March 13-18, 2019). See topline for full question wording and response options.
Figure9 More Incremental Approach To Universal Coverage: Medicare Buy-In And Medicaid Buy-In Oppose Favor allowing people who don t get health insurance at work to buy health insurance through their state Medicaid program? allowing people between the ages of 50 and 64 to buy insurance through the Medicare program? Do you favor or oppose Total 18% 75% 18% 77% By Political Party ID Democrats 12% 85% 12% 85% Independents 20% 75% 19% 75% Republicans 26% 69% 26% 64% SOURCE: KFF Health Tracking Poll (January 9-14, 2019). See topline for full question wording and response options.
Figure10 Optional Medicare-for-All More Favorable Across Parties Percent who favor the following proposals: A national health plan, sometimes called Medicare-for-all, in which all Americans would get their insurance from a single government plan A national government administered health plan similar to Medicare that would be open to anyone, but would allow people to keep the coverage they have if they prefer 56% Total 74% By Political Party ID 81% Democrats 91% 53% Independents 76% 23% Republicans 47% SOURCE: KFF Health Tracking Poll (January 9-14, 2019). See topline for full question wording and response options.
Figure11 Public Feels More Favorable Towards Medicare-For-All After Hearing That It Would Eliminate Costs, Guarantee Coverage Would you favor or oppose a national Medicare-for-all plan if you heard that it would do each of the following? Oppose Favor Lead to delays in people getting some medical tests and treatments 70% 26% Threaten the current Medicare program 60% 32% Require most Americans to pay more in taxes 60% 37% Eliminate private health insurance companies 58% 37% Eliminate all health insurance premiums and reduce out-of-pocket health care costs 30% 67% for most Americans Guarantee health insurance as a right 27% 71% for all Americans SOURCE: KFF Health Tracking Poll (January 9-14, 2019). See topline for full question wording and response options.
Figure12 Uncertainties Persist About National Health Plan Provisions Percent who think that, if a national Medicare-for-all plan was put into place, they and their family would Would Would not have to pay more in taxes to cover the cost of health insurance be able to keep their current health insurance be able to access the health care they need 19% 27% 35% 55% 67% 77% SOURCE: KFF Health Tracking Poll (January 9-14, 2019). See topline for full question wording and response options.
Figure13 Voters Say Candidate s Stance On National Health Plan Is Important, But Few Say It Is Most Important Factor In 2018 Thinking about the upcoming election, is a candidate's position on passing a national health plan the single most important factor in your vote, very important but not the most important factor, one of many factors you'll consider, or not an important factor in your vote? Single most important factor Very important, but not the most important factor One of many/Not an important factor 12% 37% 49% Voters 11% 40% 47% Battleground Voters Voters By Political Party ID 16% 45% 37% Democrats 9% 37% 54% Independents 27% 62% Republicans 9% SOURCE: KFF Health Tracking Poll (July 17-22, 2018). See topline for full question wording and response options.
Figure14 More Democrats Want Congress To Focus On Improving And Protecting ACA Than On Passing Medicare-for-all AMONG DEMOCRATS AND DEMOCRATIC-LEANING INDEPENDENTS: Do you think Democrats in Congress should focus their efforts on improving and protecting the 2010 Affordable Care Act or should they focus their efforts on passing a national Medicare-for-all plan? Passing a national Medicare-for- all plan 39% Improving and protecting the ACA 52% Other/DK /Ref. 9% SOURCE: KFF Health Tracking Poll (April 11-16, 2019). See topline for full question wording and response options.