Analysis of Social Media Marketing KPIs in English Premier League
Conducted by the Department of Telecommunications in July 2014, this bachelor's thesis analyzes key performance indicators (KPIs) related to social media marketing in the English Premier League. The study focuses on brands such as Manchester United, Chelsea, Liverpool, Arsenal, and Manchester City, examining factors like Facebook reach, growth rate, fan engagement, popularity, Google Search Index, and Internet presence. Data gathered from July 1st, 2012, to July 1st, 2013, includes significant events impacting each brand, which are then translated into dummy variables for further analysis. The research aims to understand the impact of real-life events on social media marketing KPIs.

Uploaded on Mar 07, 2025 | 1 Views
Download Presentation

Please find below an Image/Link to download the presentation.
The content on the website is provided AS IS for your information and personal use only. It may not be sold, licensed, or shared on other websites without obtaining consent from the author.If you encounter any issues during the download, it is possible that the publisher has removed the file from their server.
You are allowed to download the files provided on this website for personal or commercial use, subject to the condition that they are used lawfully. All files are the property of their respective owners.
The content on the website is provided AS IS for your information and personal use only. It may not be sold, licensed, or shared on other websites without obtaining consent from the author.
E N D
Presentation Transcript
Department of Telecommunications BACHELOR S THESIS Nr. 3695 ANALYSIS OF SOCIAL MEDIA MARKETING KEY PERFORMANCE INDICATORS Marko Sr an Zagreb, July 2014
Contents Department of Telecommunications Introduction Key Performance Indicators (KPI) definition Data gathering English Premier League (EPL) model Analysis Hypothesis Statistical Analysis Correlation Analysis Regression Analysis Conclusion Zagreb, July 2014 2 of 15
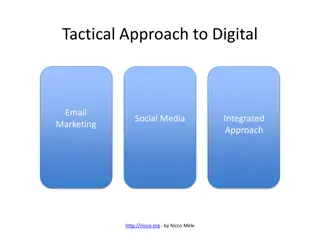
Introduction Department of Telecommunications Brands switch from traditional marketing to social media marketing (SMM) SMM is still young, therefore it is needed to find ways to improve its KPIs Analysis will be conducted on the leading English Premier League football brands Motivation find out how much real life events contribute to the SMM KPIs Zagreb, July 2014 3 of 15
Key Performance Indicators definition Department of Telecommunications Key Performance Indicators Social Media Marketing Facebook Brand s reach (daily and weekly) Brand s growth rate (daily and weekly) Brand s fan engagement (daily and weekly) Brand s popularity (daily and weekly) Search Marketing Google Search Index Internet presence (weekly) Internet trend (weekly) KPIs are set from Sunday to Sunday Zagreb, July 2014 4 of 15
Data gathering Department of Telecommunications Time period July 1st 2012 to July 1st 2013 EPL brands Manchester United, Chelsea, Liverpool, Arsenal, Manchester City Social media marketing Facebook fan pages Socialnumbers.com (link) Search marketing Google Search Index Google Trends (link) Zagreb, July 2014 5 of 15
English Premier League model Department of Telecommunications EPL model Significant events (games, transfers, news, etc.) for each EPL brand shown over time Significant events attached to data for further analysis Eventually, events are translated into dummy variables Zagreb, July 2014 6 of 15
English Premier League model Department of Telecommunications Manchester United model On the March 5th, Manchester United lost a home game in the UEFA Champions League competition Zagreb, July 2014 7 of 15
Analysis - Hypothesis Department of Telecommunications S hypothesis: Leading brands in sports industry have different weekly/daily KPI. C hypothesis: Weekly/Daily KPI of a leading sports industry brand is correlated with its other weekly/daily KPI. R hypothesis: Event1 of the leading sports industry brand contributes to their weekly/daily KPI more than the other event2 does. Zagreb, July 2014 8 of 15
Statistical Analysis - Example Department of Telecommunications S1a: Leading brands in sports industry have different weekly SMM reach. 35 Millions 30 25 20 15 10 5 0 Arsenal Chelsea Liverpool Manchester City Manchester United Zagreb, July 2014 9 of 15
Statistical Analysis - Result Department of Telecommunications Friedman s ANOVA non-parametric test concluded that: Leading brands in sports industry have different levels of ... S1a) Weekly SMM reach S2a) Weekly SMM growth rate S2b) Daily SMM growth rate S3a) Weekly SMM fan engagement S3b) Daily SMM fan engagement S4a) Weekly SMM popularity S4b) Daily SMM popularity S5a) Weekly Internet presence S5b) Weekly Internet trend Result Yes Yes Yes Yes Yes No No Yes No Zagreb, July 2014 10 of 15
Statistical Analysis - Outliers Department of Telecommunications Outliers are identified, but they exist as a result of certain internal and external factors that influenced the KPIs Box plot (talkingAboutWeekManU) 3500000 3000000 talkingAboutWeekManU 2500000 2000000 1500000 1000000 500000 Zagreb, July 2014 11 of 15
Correlation Analysis Department of Telecommunications Cn: VAR1 of a leading brand in sports industry is correlated with its VAR2 on a W/D basis. Zagreb, July 2014 12 of 15
Regression Analysis Department of Telecommunications General estimation model for all EPL brands with dummy variables Most dummy variables (Dni and Bni) and even some constants (c) are insignificant Only 9.5% of the dummy variables was significant They were supposed to estimate the impact a certain type of event has on the EPL brands SMM and search marketing KPIs Zagreb, July 2014 13 of 15
Regression Analysis - Result Department of Telecommunications Contribution of EPL derbies (B10) to Manchester United s and Manchester City s Internet trend reason for high percent of insignificant variables can be the small sample due to such a high number of regressors Zagreb, July 2014 14 of 15
Conclusion Department of Telecommunications Statistical analysis showed that there exists significant difference between EPL brand s KPIs Correlation analysis showed that Internet presence is highly correlated with Internet trend KPI SMM fan engagement is correlated with SMM growth rate and SMM popularity on a weekly level Regression analysis showed that most of the regressors were insignificant One year data sample is too small Further analysis needed Zagreb, July 2014 15 of 15