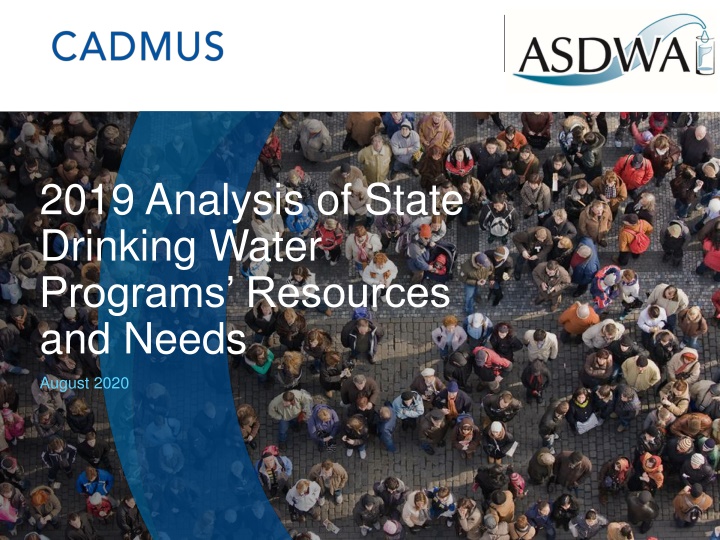
Analysis of State Drinking Water Programs Resources and Needs - August 2020
This analysis discusses the state drinking water programs' response to the pandemic, funding issues, and the path back to normal. It outlines short-term and medium-term challenges faced by states, including remote work, budget reductions, and sustainability of productivity.

Download Presentation

Please find below an Image/Link to download the presentation.
The content on the website is provided AS IS for your information and personal use only. It may not be sold, licensed, or shared on other websites without obtaining consent from the author.If you encounter any issues during the download, it is possible that the publisher has removed the file from their server.
You are allowed to download the files provided on this website for personal or commercial use, subject to the condition that they are used lawfully. All files are the property of their respective owners.
The content on the website is provided AS IS for your information and personal use only. It may not be sold, licensed, or shared on other websites without obtaining consent from the author.
E N D
Presentation Transcript
2019 Analysis of State Drinking Water Programs Resources and Needs August 2020
Agenda Pandemic Response Introduction 2019 Approach State Involvement 2019 Workload Analysis Changes and Results 2
Pandemic Response States response are falling into 3 categories 1. Short-term (first two months) Working remotely hardware, data portal issues, electronic signatures, and some communications issues (can t use Zoom) Chemical supply some early concerns with carbon dioxide (drop in methanol production) that turned out to not be a big problem 2. Medium-term (the following 2-3 months) Building re-opening & potential water quality concerns System reopening - campgrounds and other NTNC systems Operator training & operator testing different issues Resuming field work - developing protocols (what can be done prior to doing to the field), having PPE for state staff, etc. Also thinking about when/how to return staff to the office versus long-term changes to the work environment
Pandemic Response Medium Term (cont.) Funding issues start Immediate budget reductions NCSL FY 20 data: 2%-18% estimated revenue reductions Hiring freezes Furloughs 1 day/week to 1 day/month 3. The long glide path back to "normal" (just entering now) States' funding is going south Planning for larger budget reductions NCSL FY 21 data: 5%-30% estimated revenue reductions
Pandemic Response 3. The long glide path back to "normal" (cont.) How to sustain productivity? Zoom/Teams fatigue How to bring state staff back to the office? Delays in lead testing in schools and childcare facilities WIIN grants Other issues will likely arise
2019 Proposed Approach Use 2011 model as the starting point Review the current and future state workload activities by rule or program Determine if any of the workload estimates or source of the multiplier need to be revised States provide financial information for current funding and current staffing of their program Advisory Panel, ASDWA, and Cadmus/GEC meet to determine the appropriate revisions to the model Update model with new estimates and current state funding and FTEs Write an addendum to the previous report - Focus on a comprehensive program 7
2019 Approach Primary tasks were to: Review and revise drinking water program workload estimates Estimates serve as inputs for the workload model Collect current drinking water program funding and staffing levels State advisory panel comprising of nine states Ron Falco Colorado Lori Mathieu, Justin Milardo, and Rachel Nowek Connecticut Jerri Henry Idaho Jon Dilliard Montana Kristine Wheeler and Lloyd Wilson New York Shellie Chard and Kay Coffey Oklahoma Lisa Daniels Pennsylvania Mark Mayer South Dakota Cari-Michel La Caille Texas Panel supported by ASDWA and Cadmus/GEC 8
Summary of Approach for Resource Needs Analysis Approach for Main Analysis Review and revise drinking water program workload estimates as needed Collect current drinking water program financial and staffing data Compare financial survey data to workload model results Approach for Emerging Issues Analysis Collect state examples about addressing emerging issues using available resources Summarize additional burden of emerging issues through state narratives Collect financial and staffing data related to emerging issues 9
State Involvement Kristine Wheeler New York Department of Health 10
2019 Workload Analysis 11
Schedule February 22, 2019 Kick-off Call with State Advisory Panel March 2019 Member Meeting Provided overview of 2019 approach May 2019 3 Conference Calls with State Advisory Panel July 15 & 16 2019 State Advisory Panel Meeting Boulder, CO August 2019 Finalized Financial Question and Additional State Questions September to December 2019 States Provided Responses to the Financial Survey and Additional State Questions 36 States responded to the financial survey October 2019 Provided Update During a Round Table Discussion at Annual Conference December 2019 3 Conference Calls with State Advisory Panel July 27, 2020 ASDWA Finalized and Published Report 12
Purpose of the 2019 Analysis Develop a realistic estimate for a national drinking water program workload for 55 state and territorial drinking water programs Determine the severity of the gap in drinking water program resources Expand the scope to go beyond the federal mandates and to incorporate state specificity and emerging issues 13
Report Organization Methods and Approach Results The Money The Staff The Barriers The Reality Conclusion ( The Gap ) Appendices Appendix A: 2019 Financial Survey Appendix B: 2019 ASDWA State Resource Needs Analysis Request for State Input on Select Workload Estimates Appendix C: Comment Cover Letter by the ASDWA For the Proposed LCRR and the Updated 2018 Cost of States Transactions Study (CoSTS) 14
Drinking Water Program Workload Components Activities necessary to comply with the SDWA, achieve and maintain primacy, and meet eligibility criteria for federal funding. They are federally required and explicitly described in the regulations or in the SDWA. An example is tracking drinking water system compliance with SDWA regulations and implementation of the Drinking Water State Revolving Fund (DWSRF) program. Required Primacy Activities Federal Primacy Support Activities Activities necessary to ensure that state drinking water programs are able to meet primacy requirements but these activities are not specifically defined in the SDWA. An example includes managing the data system that contains drinking water system compliance information. Unique activities, regulations, and practices that state drinking water programs implement to meet federal requirements. These activities are not defined in the federal regulations, but state drinking water programs have implemented them successfully to allow states to meet their primacy requirements or otherwise ensure public health protections. An example is developing consumer confidence reports (CCRs) for water systems rather than having the water systems develop their own. Additional Primacy Activities State-Specific Activities and practices that are not federally required, but they are critical to uphold public health protection in each state. They may be required by and defined in state-specific regulations. These activities are commonly related to emerging contaminants and issues (e.g., PFAS, lead in schools, Legionella) that have not yet been regulated by the EPA, and therefore states are forced to take action to prevent compromising the ability of their water systems to deliver safe drinking water. Additional Public Health Protection Activities 15
2019 Financial Survey The purpose of the financial survey was to collect financial and staffing information from drinking water programs across the country. 36 states responded For those that responded there was varying range of change from 2011 16
2019 Workload Model Model updated from 2011 Major Updates included: Some workload activities were removed because the workload was no longer relevant Activities associated with obtaining primacy for the RTCR Activities related to the first and second rounds of source water monitoring under the LT2ESWTR Some workload activities were added Workload associated with the LCRR Additional primacy activities were taken into consideration South Dakota s workload was determined to be more similar to a very small state, rather than a small state Summary of changes is presented in Figure 4 17
Changes and Results 18
Workload Estimates Substantially Changed Lead and Copper Rule implementation and oversight Implementation of the sanitary survey program Oversight of the Capacity Development program (including all training activities) 19
Lead and Copper Rule 2011 Model assumed a static workload 2016 EPA Assistant Administrator for Water issued letters and memorandums to increase LCR oversight Panel Recommendations Raise workload for oversight of systems serving 50,000 and fewer from 2 hours to 3 hours per system Add a new line item for states to re-evaluate their LCR programs based on recent guidance/memorandums from the EPA and implement any changes that were needed Add a new line item for LCRR Used ASDWA s Costs of States Transactions Study (CoSTS) 20
Sanitary Surveys Panel believed that workload was underestimated in 2011 States are investing more time into the process to Uncover compliance problems before the violations occur Oversee the corrective action process more closely Additional activities Checking the minimum chlorine residual in the distribution system, Reviewing financial information and asset management plans, and Documenting the location and operating status of non-public wastewater systems near drinking water sources. 22
Workload Estimate Sanitary Surveys 2011 vs 2019 23
Capacity Development 2011 Model included as single line-item that covered the basics of the overseeing the Capacity Development Program 2011 Model included a separate line-item under Program Administration for Training The Panel recommended: Including the Capacity Development line for Ongoing Oversight of Program from 2011 Reassigning the training workload to the new line item called Technical Assistance and Reporting and adjusting the workload All TMF efforts to improve system operations; Technical assistance provided by state staff or third party contracted by the state; and Training for systems on existing rules, asset management, rates or fees, and other topics. 24
Workload Estimate Capacity Development 2011 vs 2019 25
The Money Current Funding Estimate - $574 million Funding sources include: Federal Sources PWSS Grant DWSRF set-asides State Sources General fund Fee programs 26
The Staff Current Staffing Estimate - 4,121 FTEs Break down the number of FTEs provided by the 36 states 27
The Barriers 28 States Provided Information 28
The Reality THE REALITY OF STATE WORKLOAD 29
The Reality THE REALITY OF STATE WORKLOAD 30
The Reality THE REALITY OF STATE WORKLOAD 31
Effects of Shortfalls in Funding and Staffing Limit on-site field assistance to water systems, including sampling assistances for contaminants; Curtail water system operator training courses that increase their skills and knowledge; Decrease support for source water protection programs; and A myriad of other programmatic reductions that could jeopardize public health protection. 32
The Reality Workload Model did not include Additional Public Health Protection Activities (particularly emerging issues) The Water Infrastructure Improvements for the Nation (WIIN) Act of 2016, three new grants The America's Water Infrastructure Act (AWIA) of 2018, which impacts federal mandates for CCRs, Capacity Development programs, and emergency response planning, among others The response to address the world pandemic related to COVID-19 33
The Reality The Reality of Emerging Issues Programs have seen a tremendous growth in programmatic demands without adequate resources to address those demands In 2018, ASDWA surveyed states regarding resource needs for quasi-regulatory activities. Of the 25 respondents, states reported workload increases ranging from 1.1 to 12.5 percent, with an average workload increase of 4.3 percent, beyond their current level of activity. State actions to address emerging issues and protect public health have been necessitated by a slow federal response Section includes state stories 34
Percentage of States that Reported FTEs for Emerging Issues 35
The Reality of Emerging Issues PFAS Identified by 21 out of 36 states (58%). These states had dedicated an estimated 33.5 FTEs and an additional $2.3 million to PFAS efforts in 2019. Lead in Schools Identified by 19 out of 36 states (53%) These states had dedicated an estimated 22.3 FTEs and an additional $430,000 to lead in schools work in 2019. COVID-19 Pandemic Expect budget reductions of 5 to 30 percent and staff furloughs Risk Communication 36
The Gap 37
The Gap 38