Analysis of Storage Failures - Weekly Group Meeting
This report delves into various types of storage failures discussed in a weekly group meeting led by Reza Eftekhary. It covers insights on failure rates, impacts of different parameters, and statistical properties of failures within storage systems.

Download Presentation

Please find below an Image/Link to download the presentation.
The content on the website is provided AS IS for your information and personal use only. It may not be sold, licensed, or shared on other websites without obtaining consent from the author.If you encounter any issues during the download, it is possible that the publisher has removed the file from their server.
You are allowed to download the files provided on this website for personal or commercial use, subject to the condition that they are used lawfully. All files are the property of their respective owners.
The content on the website is provided AS IS for your information and personal use only. It may not be sold, licensed, or shared on other websites without obtaining consent from the author.
E N D
Presentation Transcript
Analysis of Storage Failures Weekly Group Meeting Reza eftekhary 1
3 Type of failure Disk Interconnects Protocol Performance I/o request path Processor
4 Failure Rates MTTF Mean Time to Failure AFR Annual Failure Rate ARR Annual Replacement Rate
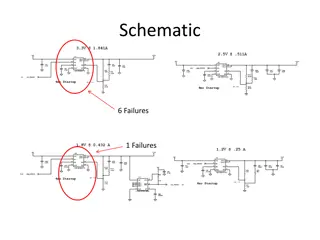
5 Failure rate F1: Disk failures (20 55%), Physical interconnect failures (27 68%) Protocol failures and performance failures noticeable fractions.
6 Failure rate F2: For disks Near-line storage systems show higher (1.9%) AFR than low- end storage systems (0.9%). For the whole storage subsystem near-line storage systems show lower (3.4%) AFR than low-end storage systems (4.6%).
7 Impact of Parameters On Failures Disk model F3: Storage subsystems using disks from problematic disk family show much higher AFR than other.
8 Impact of Parameters On Failures Disk model F4: Storage subsystems using same disk Similar disk failure rates across different environments, But very different storage subsystem failure rates
9 Impact of Parameters On Failures Disk model F5 : The AFR for disks and storage subsystems does not increase with disk size.
10 Impact of Parameters On Failures Enclosure model F6: The shelf enclosure model Strong impact on storage subsystem failures, Different shelf enclosure models work better with different disk models.
11 Impact of Parameters On Failures Network Redundancy Mechanism F7: Subsystems with network redundancy Much lower (30 40% lower) AFR than other systems. AFR for physical interconnects reduce by 50 60%.
12 Statistical Properties of Failure Time Between Failures F8&9&10:Physical interconnect, protocol, and performance failures show much stronger temporal locality than disk failures.
13 Statistical Properties of Failure Correlation F11: For each failure type, storage subsystem failures are not independent. After one failure, the probability of additional failures is higher. Cause of correlation Failure probability depends on environmental factors: temperature, cooling facility Most physical interconnect components, shared in the same shelf or in the same RAID group
Analysis of Disk Failure 14
15 Disk Failure MTTF Mean Time to Failure AFR Annual Failure Rate ARR Annual Replacement Rate
16 AFR VS ARR AFRs are between 0.58% and 0.88%, Observed ARRs range from 0.5% to 13.5%
17 Disk replacement rates O1:Variation between datasheet MTTF and disk replacement rates The weighted average ARR was 3.4 times larger than 0.88%
18 Disk replacement rates O2: For older systems (5-8 years of age), ARR are bigger than AFR as much as a factor of 30. O3: During the first few years of a system s lifetime (< 3 years),the difference was as large as a factor of 6.
19 Disk replacement rates O4: Same replacement rates of SCSI or FC disks. Disk independent factors, affect replacement rates more than component specific factors Like: operating conditions, usage and environmental factors, affect replacement rates more than component specific factors
20 Disk replacement rates Disk Age O5: Hard drive replacement rates Do not enter steady state after the first year Replacement rates seem to steadily increase over time.
21 Disk replacement rates Disk Age O6: Early onset of wear-out seems to have a much stronger impact on lifecycle replacement rates than infant mortality,
22 Correlations Observation 7: Disk replacement counts exhibit significant levels of autocorrelation.
Processor Failure 23
24 Type of failure Hardware Errors Software Errors Power issues Radiation-induced errors. Soft errors Single Event Upset
25 Single Event Upset Occasional malfunctions of the hardware that are not reproducible. generated by cosmic particles, energetic neutrons and alpha particles Hit the surface of silicon devices
26 SEU Unavailability transient errors take the system to an invalid state Internal structure is not observable, so determining soft error rates is more challenging
27 Soft Error Rate Soft Error Rate estimation o Soft Error Sensitivity o Probability of whether a soft error will cause an incorrect architectural state. o Architectural vulnerability factor (AVF) o Probability that a fault will cause an error in output. o Using MCA o Enable system to diagnose, isolate MP failures
28 Soft Error Rate-MCA Errors occurred inside MP (SEUcpu) using error logs, labeled as Probable soft errors Invalid memory addresses (SEUINVMEM.) not faulty software, not point to a register Errors logs did not point to fault in HW or SW (SEU No-info)
29 Cause of Failure
30 Reference [1] S.Z. Shazli, M.Abdul-Aziz, M.B.Tahoori, D.R.Kaeli. "A Field Analysis of System-level Effects of Soft Errors Occurring in Microprocessors used in Information Systems". in Proceeding of Int l Test Conf. (ITC 08), IEEE CS Press, 2008, pp. 1-10. [2] Weihang Jiang , etl al. , Are Disks the Dominant Contributor for Storage Failures? FAST 2008 [3] B. Schroeder and G. A. Gibson. Disk Failures in the Real World: What Does an MTTF of 1,000,000 Hours Mean to You? , In Proceedings of the 5th USENIX Symposium on File and Storage Technologies (FAST 07), San Jose, California, Feb. 2007.