Analysis of Summary Data: Heights, Distributions, Regression Lines, and Correlation Coefficients
Various statistical concepts including variance calculation, expected values in random variables, regression line equations, product moment correlation coefficients, skewness, probability events, and standard deviation formulas.

Download Presentation

Please find below an Image/Link to download the presentation.
The content on the website is provided AS IS for your information and personal use only. It may not be sold, licensed, or shared on other websites without obtaining consent from the author.If you encounter any issues during the download, it is possible that the publisher has removed the file from their server.
You are allowed to download the files provided on this website for personal or commercial use, subject to the condition that they are used lawfully. All files are the property of their respective owners.
The content on the website is provided AS IS for your information and personal use only. It may not be sold, licensed, or shared on other websites without obtaining consent from the author.
E N D
Presentation Transcript
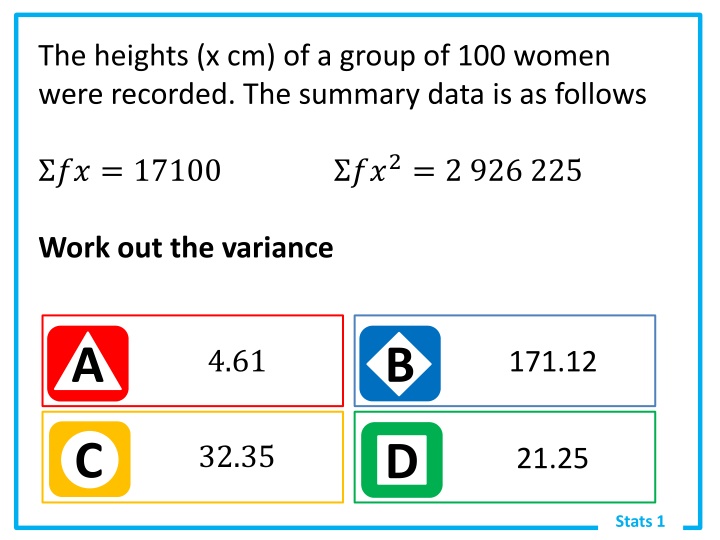
The heights (x cm) of a group of 100 women were recorded. The summary data is as follows ??2= 2 926 225 ?? = 17100 Work out the variance B A 4.61 171.12 C D 32.35 21.25 Stats 1
The random variable x has the following distribution: x -1 1 20 0 3 20 1 1 4 2 1 10 3 3 10 P(X=x) Find E(X) 77 10 17 5 B A 7 5 13 10 C D Stats 1
The random variable x has the following distribution: x -1 1 20 0 3 20 1 1 4 2 1 10 3 3 10 P(X=x) Given that ? = ?? ? find ?(? ?) 13 20 1 5 B A 19 3 C D 1 Stats 1
Given that the coding ? = ? + 2 and ? = ? 3 has been used to get the regression equation ? + ? = 5 find the equation of the regression line of ? on ? in the form y = ? + ?? B A ? + ? = 6 ? = 4 ? C D ? = 6 ? ? + ? = 4 Stats 1
Given the following summary data calculate ??? n = 15 ? = 176.9 ? = 679 x2= 2576.47 y2= 39771 ?? = 9915.3 B A 490.23 9034.93 C D 39119.6 458389.6 Stats 1
Given the following summary data calculate the product moment correlation coefficient (r) ???= 490.23 ???= 9034.93 ???= 1907.63 B A 0.118 4.29 C D 0.906 9.343 Stats 1
Which of the following describes a positive skew? A ?2 ?1< ?3 ?2 B ?2 ?1> ?3 ?2 C ???? < ?????? < ???? D ???? > ?????? > ???? Stats 1
There are two events such that P A = 0.45 , ? ? = 0.3 and ? ? ? = 0.03 . Find ? ? ? B A 0.42 0.0 6 C D 0.4 9 0 0.1 Stats 1
Which of the following is the correct formula for standard deviation? 2 ?2 ? ?2 ? ? ? ? B A ? 2 2 ?2 ? ? ? ?2 ? ? ? C D Stats 1
Find ?(? ?) ? ? 4 15 1 15 2 15 8 15 4 5 A B 15 15 1 1 3 C D 15 Stats 1
The random variable ?~?(100,225) Find the z value such that ? ? > ? = ?.??? A B 0.8365 0.8365 C D 1.96 1.96 Stats 1
The random variable ?~?(100,225) Find the variable of ? such that ? ? > ? = ?.??? A B 341 70.6 C D 129.4 29 Stats 1
What is the frequency for 25-50? 1 ? ? > ? = ?.??? 0.8 0.6 0.4 0.2 0 A B 0.6 41.67 C D 15 30 Stats 1
The heights of a large group of men are normally distributed with a mean of 175cm and a standard deviation of 4cm. A man is randomly selected from the group. Find the z value for a height of 170cm B A ? = 0.3125 ? = 1.25 C D ? = 1.25 ? = 0.3125 Stats 1
The heights of a large group of men are normally distributed with a mean of 175cm and a standard deviation of 4cm. A man is randomly selected from the group. Find the probability that the man is shorter than 170cm B A 0.2133 0.8944 C D 0.1056 0.8925 Stats 1
 of a group of 100 women")


")
")
")